Energy efficiency • Energy intensity in copper and gold mining
 Quelle/Source: Metso Corporation
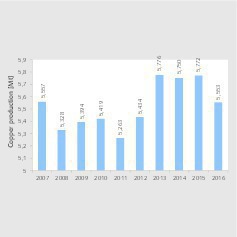
 Quelle/Source: ICSG
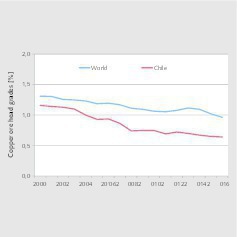
 Quelle/Source: World Gold Council
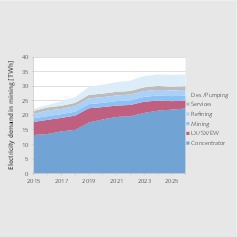
 Quelle/Source: Cochilco
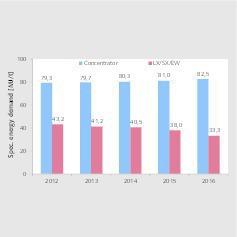
 Quelle/Source: Cochilco
 Quelle/Source: ICSG, Cochilco
 Quelle/Source: Cochilco
 Quelle/Source: Cochilco
 Quelle/Source: Freeport McMoRan
 Quelle/Source: Freeport McMoRan
 Quelle/Source: [1]
 Quelle/Source: FLSmidth
 Quelle/Source: Metso
 Quelle/Source: Glencore Technology
 Quelle/Source: Metso
 Quelle/Source: Outotec
 Quelle/Source: BHP Billition
![17 Spezifische Mahlenergie für Kupfererz [1] • Specific comminution energy for copper ore [1]](https://www.at-minerals.com/imgs/1/2/1/8/2/1/6/17_Harder_237_237-5ba5b39d44de4426.jpg) Quelle/Source: [1]
Quelle/Source: [1]
![18 Spezifische Mahlenergie für Golderz [1] • Specific comminution energy for gold ore [1]](https://www.at-minerals.com/imgs/1/2/1/8/2/1/6/18_Harder_237_237-c836b7cee9a5dc07.jpg) Quelle/Source: [1]
Quelle/Source: [1]
 Quelle/Source: Teck, Barrick Gold
 Quelle/Source: Gold Fields
 Quelle/Source: Barrick Gold

Summary: Mines are faced with numerous challenges, such as falling raw material prices, declining metal grades in the ores and higher energy prices. Especially because ore processing is particularly energy-intensive, the industry is again focusing on the saving of energy. This report shows what are the key energy saving considerations in the copper and gold mining sectors.
1 Introduction
In recent years, many mining companies have been able to reduce their specific energy requirements in the ore processing of base metals, gold, silver and platinum group metals, thereby improving their competitiveness. The reasons are complex and involve, for example, the closure of unprofitable mines, technological improvements such as modern grinding processes or improved energy management. But there are also opposing tendencies. For example, the electricity demand for Chile’s copper production is expected to increase by 53.5 % between 2015 and 2026, although the planned increase in copper production over that period is only 7.5 %. An analysis of the reasons for this reveals that the contributing factors are not only the type of ore dressing process, but also the declining ore head grades and the supply of water to the mines.
2 Market data for copper and gold mining
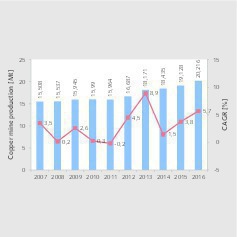
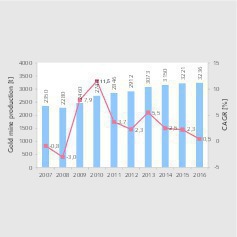
After iron ore, the leading places in the global sales ranking for mineral raw materials are occupied by copper and gold. Despite an interim sales crisis, the demand for copper and gold is unbroken. Fig. 1 shows the development of copper mine production over the last 10 years. Production has risen at average annual growth rates (CAGR) of 3.0 % to 20.2 million t (Mt). The annual growth fluctuations were between 8.9 % and -0.2 %. In the case of gold production, the situation is similar (Fig. 2). The CAGR of gold production was 3.6 % in the last 10 years. In 2016, 3260 tonnes of gold were produced, after 2350 tonnes in 2007 and a relatively small slump in gold production during the financial crisis of 2008.
In principle, it is clear that higher productions can only be realized with a greater energy expenditure. This technical paper will particularly consider the electrical energy input in more detail. The electrical energy input and the fuel requirements are roughly the same in the gold and copper production sectors. Of particular interest is the specific energy input per ton of recovered copper or gold. The relevant data are provided primarily by the mining companies. To a lesser extent, data are available from individual mining associations. Further data sources are energy audits and the project descriptions of consulting companies for mine expansions and new copper and gold mining projects. The situation is fundamentally similar in the case of other mineral raw materials.
3 Specific data on copper production in Chile
At present, copper production is stagnating in Chile (Fig. 3). In 2013, a peak mining output of 5,776 Mt was reached, while in 2016 the production figure was 5.553 Mt, corresponding to a share of 27.5 % in the worldwide mining output of 20.2 Mt. Starting from 2015, the Chilean Copper Commission (Cochilco) is planning to increase the annual mining output by 0.5 % in order to achieve about 6.2 Mt by 2026. In 2015, Cochilco published a study on the future electricity demand of the Chilean copper mining industry. This study covers all current and future projects. Fig. 4 shows how the future electricity demand is forecast to change from 22.1 terawatt hours (TWh) in 2015 to 34.1 TWh. The various consumers are also shown.
The largest consumer is the conventional ore dressing process with a concentrator as used for sulfidic ores, consisting of crushing, grinding and subsequent flotation. This is followed by processes for oxidic copper ores with heap leaching, solvent extraction and electrowinning (LS-SX-EW). The share of ore production by concentrator processes will increase from 72 % in 2015 to 89 % in 2026. Correspondingly, the electricity demand for the concentrator processes will increase by 69 % from 13.2 TWh to 22.3 TWh in 2026 while that of the LS-SX-EW processes will decrease by 40 % from 4.5 TWh to 2.7 TWh. Also interesting is the increase of almost 460 % for seawater desalination/pumping. The increases in mining (+38 %), refining (+30 %) and services (+26 %) within the framework of the planned additional mining output are somewhat more moderate, but clearly exceed the planned production growth.
For many years the copper ore grades have been declining as exploitation of the higher-grade deposits progresses. On a worldwide scale, the mined ores contain an average of less than 1.0 % Cu (Fig. 5). In Chile, the copper grade of the ores is significantly lower than even that. In 2015, the average copper grade in the ores was only 0.65 %. For the year 2026, it is expected that the ores in Chile will have copper grades of less than 0.5 %. This will naturally increase the amount of run-of-mine ore that has to be processed. In international comparison, the Chilean copper ore mining industry is steadily deteriorating. While about 35 % of the worldwide copper mine output had higher copper grades than the product of Chilean mines in 2010, this figure will rise to 43 % in 2020.
Fig. 6 shows the development of the electricity demand for concentrator and LS-SX-EW processes. While in the case of concentrator processes the specific electricity demand per t of material has increased by 4 % from 79.3 MJ/t to 82.5 MJ/t, the power demand for the LS-SX-EW processes has decreased by almost 23 % from 43.2 MJ/t to 33.3 MJ/t. The figure also shows that the power demand per t of material is significantly lower in the case of LS-SX-EW processes. However, in the concentrator processes this disadvantage is compensated by higher yields. As depicted in Fig. 7, the specific electricity demand per ton of produced copper is currently about 12.0 GJ/t of copper (Cu) in both the concentrator and the LS-SX-EW processes. However, in the case of plants equipped with concentrators, this value has increased at a faster overall rate over the past 10 years.
4 Fundamentals of energy demand in mining operations
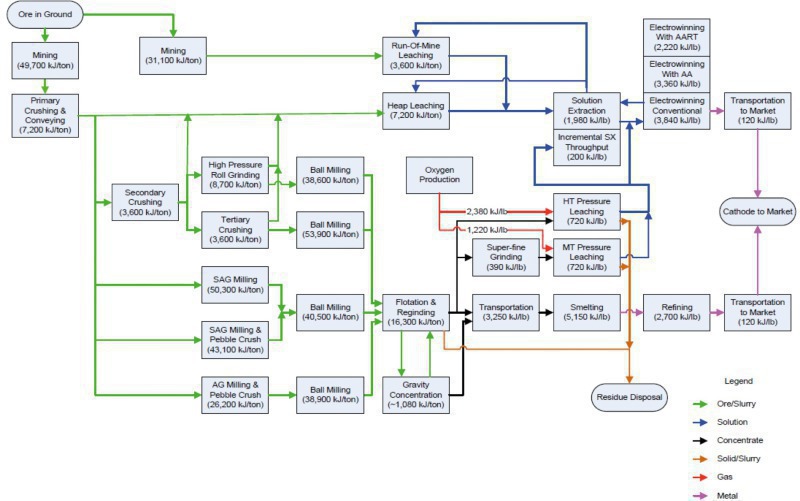
The mineralogical properties of the ores are increasingly influencing the required processing methods. In the production of copper, sulfidic ores are enriched into concentrates by grinding and flotation, followed by pyrometallurgical processes for the production of pure copper. Oxidic ores are treated with sulfuric acid in a heap leaching process after the grinding stage and are subsequently processed into cathode copper by SX/EW methods. On a worldwide scale, concentrate production dominates with a market share of about 85 %. In the production of gold, the cyanide leaching or CIL (carbon-in-leach) processes have gained a market share of almost 90 %. For the worldwide energy demand of these processes only estimated figures are currently available.
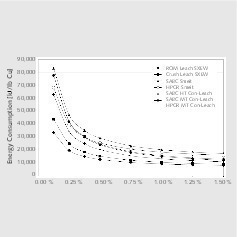
Fig. 8 presents a simplified overview of the energy input for the different processes and process stages in the production of copper based on a copper ore grade of 0.5 %. The energy inputs are expressed in kJ/t of material and kJ/lb (pound of copper). The so-called run-of-mine (ROM) leaching followed by a SX/EW process has the lowest energy demand, while the process with SAG/ball mills and subsequent flotation and pyrometallurgy has the highest energy demand. For each respective process, various possibilities for reducing the energy input are shown. Fig. 9 additionally shows how the energy demand for the different processes varies depending on the copper grade of the ore. Correspondingly, the respective theoretical energy inputs range from less than 10 MJ/lb Cu up to more than 80 MJ/lb Cu.
The greatest energy input in copper and gold production is required for the comminution and grinding processes. The energy audit of mainly Australian copper and gold mines shows that 36 % of the overall energy consumption is attributable to comminution [1]. Previous studies had shown values between 18 % and 50 %. Fig. 10 shows that the specific comminution energy is a function of the copper grade of the ore, but also a function of the throughput of the mine and thus of the technology employed. Therefore, on the one hand, the declining copper grades require higher specific energies of more than 4 MWh/t Cu, while on the other hand, so-called scale effects occur in the case of larger mines and partially compensate for poorer copper grades, making specific comminution energies of less than 1 MWh/t Cu possible.
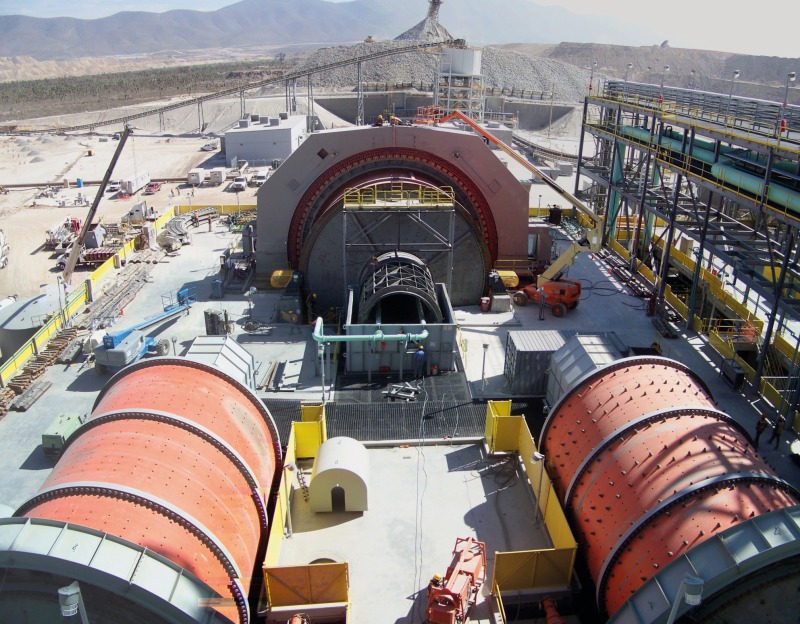
The classical grinding process employing SAG and ball mills (Fig. 11) is progressively losing ground [2, 3] against high-pressure grinding rolls (HPGR), which are increasingly being used for the grinding of both copper and gold ore. The first noteworthy HPGR application was at the Cyprus Sierrita copper mine in the USA in 1995 [4], even though the extremely abrasive ore prevented the achievement of economic grinding roll service lives. This changed with the Cerro Verde project, a copper-molybdenum mine in Peru in 2006 and later in 2011, when the SAG mills were completely replaced by 4 HPGRs, each with a capacity of 2100 t/h [5]. In 2014, the largest HPGR that has been implemented so far was installed in Freeport-McMoRan’s Morenci copper mine in Arizona/USA, achieving throughputs of up to 5400 t/h (Fig. 12). Pilot studies had demonstrated that the HPGR can achieve energy savings of 13.5 % compared to grinding processes employing SAG mills. By 2014, more than 35 HPGR had already been put into operation in the copper grinding industry.
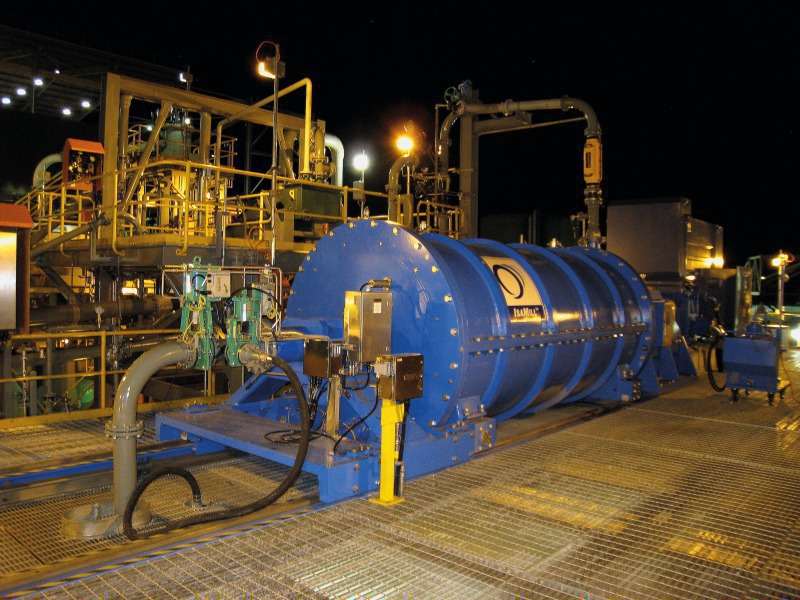
A further important area for power consumption reductions is the after-grinding of products from the flotation stage [3, 6, 7]. Here, the fineness requirements are in the broad range of 2 to 75 μm, the feed particle sizes are smaller than 200 μm and the throughput rates are usually below 100 t/h, so that due to their high energy requirements ball mills do not represent a reasonable solution in this range of fineness. With the IsaMill horizontal stirred media mill (Fig. 13), it is possible to achieve energy savings of 20-30 % compared to conventional ball mills [10] in various applications. High energy savings are also achieved with vertical flow stirred media mills (Fig. 14). Due to their relatively low energy requirements, both these mill types are also being increasingly used for secondary and tertiary grinding as replacements for ball mills [8, 9, 10].
The decreasing mineral grades in the ores have also led to increased throughput rates in the flotation stage (Fig. 15). In order to accommodate higher flotation volumes, plant manufacturers have undertaken a scale-up of the flotation cells. So-called supercells are now available with volumes of up to 600 m3 [11]. It is of particular interest in this context that the larger cells provide an improved hydrodynamic performance compared to small cells using conventional technology, a factor which reduces energy costs by up to 40 %. However, the amount of savings thus achieved for the entire processing line must be put into perspective, since the flotation stage usually accounts for less than 10 % of the energy costs for the grinding stage.
Two other areas that are also among the notable energy consumers are the mechanical handling of the material and the pump conveyance of liquids and slurries. Mechanical conveyor systems (Fig. 16) are indispensable for feeding the processing equipment. In addition, there are various mechanical conveyors in the mine itself. The consumed electrical energy amounts to less than 5 % of that of the total ore processing line. The energy consumption situation for pumping is somewhat different. In particular, when seawater desalination plants and long-distance water supply are included, the electrical energy consumption can rise to over 15 % of the total. High energy losses occur, in particular, when slurry pumps suffer premature wear. This problem can be reduced by special designs, such as wear rings in the pump.
5 Energy intensity of selected mining companies
Australian scientists have evaluated the energy consumption of a total of 68 copper and gold mines covering all such mines in Australia as well as 24 % of the world’s copper mines and 15 % of the world’s gold mines [1]. While complete data for SAG and ball mills were available, only partial data were obtained for crushers and post-grinding, so that some results were estimated. Fig. 17 presents the results for the specific comminution energy for the grinding of copper ore. The average consumption is 1.223 MWh/t Cu. On the abscissa, the cumulative copper production quantity of the analyzed mines is shown. A corresponding graph also exists for the analyzed gold mines (Fig. 18). This represents mines with a production of 11 million ounces (Moz). The average specific comminution energy is 353 kWh/oz.
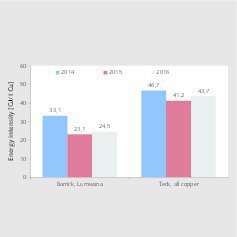
Fig. 19 depicts the specific energy consumption of the companies Teck Resources and Barrick Gold in the copper ore processing sector. The specific data are shown in GJ/t Cu and thus provide a measure of the energy intensity of the copper production process. In the case of Teck Resources, the data represent 4 mines in Canada, Chile and Peru with a total production volume of 324 kt in 2016. Barrick Gold has only the Lumwana copper mine in Zambia with a most recent production volume of 123 kt. With both companies there is a trend towards lower energy intensities over the past three years. The energy intensity of 24.5 GJ/t Cu at the Lumwana mine is significantly lower than Teck’s average value of 43.7 GJ/t Cu in 2016.
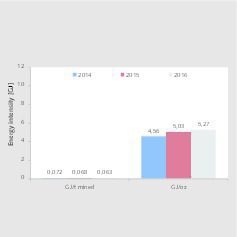
Fig. 20 shows the energy intensity for the company Gold Fields. Gold Fields operates 3 gold mines in South Africa, Australia and Ghana as well as a copper/gold mine in Peru. In 2016, the company produced 2,15 Moz of gold (calculated as gold equivalent), which was almost equal to the previous year’s figure of 2.16 Moz. For the 2016 gold production quantity an energy input of 0.063 GJ/t of ore material was necessary, after the figure of 0.072 GJ/t in 2014. The energy intensity for gold production was 5.27 GJ/oz in 2016 after 4.56 GJ/oz in 2014. This means that the energy intensity increased over the two years with a CAGR of 7.5 %. Such an increase can only be explained by a sharp decline in the grade of gold in the ore.
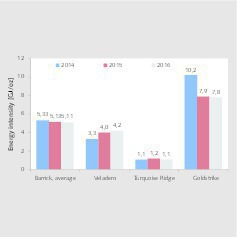
Fig. 21 shows the energy intensity of the company Barrick Gold for the gold production of selected mines. In total, Barrick Gold owns 9 gold mines in Argentina (Veladero), Canada, the Dominican Republic, Peru and the USA (Cortez, Goldstrike, Turquoise Ridge and Golden Sunlight). In 2016, the company produced a total of 5.52 Moz of gold, making Barrick the no. 1 worldwide, ahead of Newmont Mining and AngloGold Ashanti. The average energy intensity of the 9 goldmines decreased from 5.33 GJ/oz in 2014 to 5.11 GK/oz in 2016. However, the 3 depicted mines have significantly different energy intensity levels and graph bar sequences. Goldstrike is among the Barrick Gold mines with the highest energy intensity, although its energy demand has been reduced. Turquoise Ridge has the lowest energy demand with minor fluctuations in recent years. Veladoro’s energy demand showed an upward trend.
6 Market prospects
Lower metal grades in the ores force mine operators to look for solutions in order to further reduce the energy demand of their processing lines. If no efforts were made, the energy demand would rise significantly. Mining companies are increasingly carrying out energy audits in order to identify the largest energy consumers and to see how plant performance can be improved. The main focus is on the grinding process, as it is the largest energy consumer. For new projects, more energy-efficient grinding processes should be considered, employing HPGR instead of SAG mills and vertical and horizontal stirred media mills instead of ball mills. An important role in energy demand reduction is played by the optimization of grinding circuits [13].
In the case of performance enhancements and Brownfield projects, the focus is on adding machines to existing circuits or replacing machines with higher-performance equipment. HPGR mills and stirred media mills also play an important role here as a simple means of achieving higher throughputs with an additional grinding circuit or other machine combinations. This also concerns the post-grinding after flotation and the replacement of existing flotation cells with new, higher-performance and larger cells in order to achieve longer residence times and better yields. In the recent past, ore selection by sensor-based processes has also been intensively discussed. In any case, mine operators today have numerous options for energy saving while simultaneously reducing cash costs.