North America’s mining industry in the spotlight
Summary: Canada, Australia and the United States are at the forefront in terms of global exploration budgets. For the two North American countries, this report presents the current prospects and trends in the mining sector and examines the key mining companies.
1 Introduction
In 2018, global exploration budgets for non-ferrous metals increased by 19 % to approximately US$ 10.1 billion (bn) from US$ 8.5 bn in 2017. This is the result of an analysis of the investments made by 1651 mining companies, carried out by S&P Global Market Intelligence [1]. The increase was triggered by so-called battery metals such as nickel, cobalt and lithium, and also in particular by the high demand for gold and for the base metals copper and zinc. As in previous years, Canada has the highest investment budgets of US$ 1.44 bn (14.3 %) in 2018, which was an increase of 31 % over 2017. Australia takes second place with US$ 1.33 bn (13.2 %), while the US accounts for more than US$ 0.8 bn (8 %). Gold exploration accounts for more than 55 % of investment expenditure in each of these three countries.
2 The mining industry in Canada
2.1 Overview
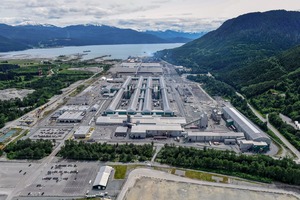
Canada is the world‘s largest producer of potash, and is one of the world‘s top 5 countries for aluminium (Fig. 1), diamonds, gold, cobalt, nickel, platinum group metals and uranium. In 2017, the country‘s largest mine revenues were achieved with gold (Can$ 8.7 bn), coal (Can$ 6.2 bn), copper (Can$ 4.7 bn), potash (Can$ 4.6 bn), iron ore (Can$ 3.8 bn), nickel (Can$ 2.7 bn) and diamonds (Can$ 2.6 bn). In total, there are 1200 companies in the mining industry with more than 400 000 direct employees. 65 of these companies are in the metal-mining sector, while 1136 are in non-metals. In 2017, the amount of GDP value creation amounted to about Can$ 72 bn. Another important factor in Canada is the production of crude oil from oil sands. In 2018, 2.854 million barrels per day (MMb/d) were recovered, compared to 2.675 MMb/d in 2017. A production rate of 4.192 MMb/d is planned for 2035. This will require a large amount of further investment [2].
2.2 Investments by the mining industry
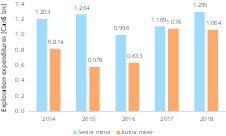
In Canada, investments by mining companies are analyzed by the Ministry for National Resources (NRCan). Fig. 2 illustrates the evolution of exploration expenditures from 2014 to 2018 with updated figures for 2018, depicted in accordance with type of mining company. The figure shows the slump in exploration budgets to Can$ 1.629 bn in 2016 and the rapid increase in 2017 and 2018 to Can$ 2.360 bn. Another prominent feature is the growing proportion of so-called junior miners in recent years. Junior miners are mining companies that place their particular emphasis on exploration and investigation, but not on the actual extraction of metals. A striking number of such companies are only concerned with one metal, such as gold, and have only a small portfolio of exploration projects.
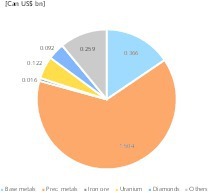
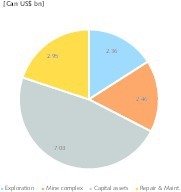
Fig. 3 shows the exploration expenditures in Canada in 2018 for the most important commodities. The greater proportion of these expenditures – Can$ 1.504 bn or 64 % of the total outlay – went on precious metals such as gold and platinum group metals. Base metals such as copper and nickel follow with Can$ 0.366 bn or 16 %. Taken together, all the other commodities account for only 20 % of the expenditure, with iron ore mining at 1 % and uranium at 5 %. Diamond mines account for 4 %. However, exploration expenditures, coming in at 16 %, account for only a fraction of the total budget of the mining companies, as depicted in Fig. 4. The major proportion is devoted to equipment investment at 48 %. Even the spending on maintenance and repair, at 20 %, is higher than the expenditure for exploration.
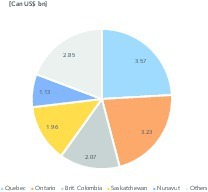
Fig. 5 shows the mining companies‘ budget for 2018 split up into provinces. More than 80 % of the total is spent in the 5 provinces of Quebec, Ontario, British Columbia, Saskatchewan and Nunavut. Quebec leads with a sum of Can$ 3.57 bn, or 24 %, ahead of Ontario with Can$ 3.23 bn or 22 %. Of the remaining 6 provinces of Newfoundland and Labrador, Nova Scotia, New Brunswick, Manitoba, Alberta, Yukon and the Northwest Territories, more than 34 % is accounted for by Newfoundland and Labrador alone, while Yukon and the Northwest Territories are responsible for an additional 28 %, which underlines the importance of the northern, Arctic provinces [3].
2.3 The most important commodities in Canada
Gold, copper, nickel and diamonds are of paramount importance to the Canadian mining industry. In early 2018, the gold price marked its high point for the year at US$ 1359.88 per troy ounce. Currently (04 April 2019), the price of this precious metal stands at US$ 1291.81. The major US bank Goldman Sachs is confident that the price of gold will reach the magic figure of US$ 1350 per troy ounce in 2019. The increasing state of political uncertainty, as well as concerns over the further escalation of trade disputes, especially between the United States and China, could push up the price of gold. Unlike investors, gold producers can regard a price of more than US$ 1100 as very satisfactory, given their cash costs of sometimes below US$ 600 per troy ounce. This explains the current upturn for new gold mining projects.
Almost 50 gold mining companies are listed on the Toronto Stock Exchange. In 2017, 176.2 t of gold was produced in Canada, an increase of 80 % over the output of 10 years ago. The largest production quantities were accounted for by Ontario with 76.2 t, Quebec with 57.4 t and British Colombia with 19.7 t. Canada is now 5th in the world ranking, behind China (426.1 t), Australia (295.0 t), Russia (271.0 t) and the USA (230.0 t). In 2017, gold exports amounted to Can$ 18.6 bn. Wood Mackenzie analysts expect Canada to move up to second place in the international ranking in the next 5 years with a production quantity of about 300 t. This is a result of the many new mining projects in almost all areas of Canada.
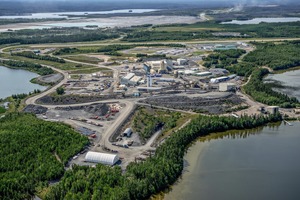
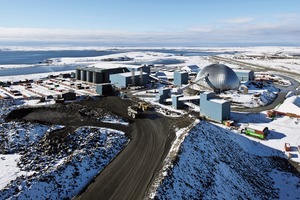
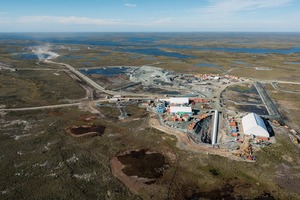
Among the major gold mining companies in Canada are Agnico Eagle, Goldcorp, Barrick Gold, Yamama Gold, Kirkland Lake Gold and Barrick Gold. The many mid-tier and junior miners include Alamos Gold, Atlantic Gold Corp., Detour Gold, First Mining Gold, IDM Mining, Marathon Gold, Newgold, Richmond Mines, TMAC Resources, Victoria Gold and Wesdome Gold. Agnico Eagle owns 8 producing gold mines, including 5 in Canada. The company‘s largest gold mines include Medowbank (Fig. 6) in Nunavut, and La Ronde, Goldex, Lapa and Canadian Malartic in Quebec. Agnico Eagle and Yamama Gold both hold a 50 % stake in the Malartic Mine (Fig. 7). In 2017, Agnico Eagle produced 1.178 million ounces (MOz) of gold in Canada. In addition, the company is pursuing very important expansion projects at the Amaruq and Meliadine mines (Fig. 8) in Nunavut.
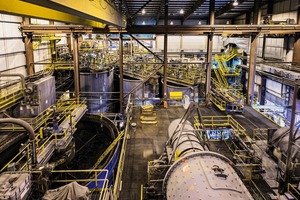
Currently, Goldcorp is probably the second-largest gold producer in Canada with its 3 mines Porcupine, Musselwhite (Fig. 9) and Red Lake in Ontario, plus Éléonore in Quebec. In 2017, it produced 1.022 MOz there. For 2018, the company‘s target was 1.1 MOz, but it is not expected to actually achieve this figure. Goldcorp is intending to expand its global production from 2.5 MOz in 2017 to 3.0 MOZ in 2021, with Canada playing a key role in this plan. Yamama Gold is currently ranked 3rd with a production volume of 0.316 MOz from its 50 % stake in the Canadian Malartic Mine. Yamama is closely followed by Kirkland Lake Gold, who produced a total of 0.312 MOz gold from its 3 mines Macassa, Holt and Taylor in 2017. Barrick Gold follows with 0.171 MOz from its Hemlo Mine.
In 2017, 604 000 t of copper were produced in Canada. However, this only puts the country in 12th place in the global ranking. The ranking is headed by Chile with 5500 t, Peru with 2445 t and China with 1706 t. The leading producers in Canada include Vale Canada and Teck. Vale owns 5 copper mines in Ontario and 2 in Manitoba. In 2017, these mines produced a total of 136 700 t of copper. In 2017, Teck achieved a copper production quantity of 93 000 t. In the case of nickel, Canada had a production volume of 211 900 t in 2017, putting it in 5th place in the international ranking behind the Philippines (366 kt), Kazakhstan (345 kt), New Caledonia (215 kt) and Russia 212 kt). With its 3 mines in Sudbury, Voisey‘s Bay and Thompson, Vale alone accounts for 134 000 t, or 63 % of Canada‘s output.
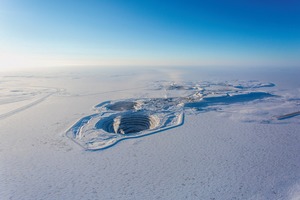
In the diamond production sector, Canada was in second place in the global ranking in 2017 with 23.234 million carats (MMC) or 15.4 % of total mining production, behind Russia with 28.2 %. As regards the value of its diamond production, Canada is in 3rd place in the global ranking with US$ 2.06 bn, and 14.6 %, behind Russia with 29.1 % and Botswana with 23.6 %. The largest diamond mining company is the Dominion Diamond Corporation. It owns the Ekati Mine, which produced a total of 5.2 MMC in 2017. In addition, the company has a 40 % stake in the Diavik Mine (Fig. 10). The other 60 % of the Diavik mine is held by Rio Tinto, who also operate the mine, which produced 7.263 MMC in 2018. Rio Tinto‘s share amounted to 4.358 MMC.
3 The mining industry in the USA
3.1 Overview
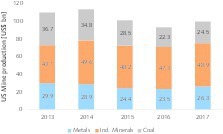
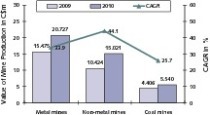
The status of the US as a leading economic power generating about one fifth of the world‘s annual income is based on a large and developed national territory which is rich in natural resources [4]. One important factor is the large domestic market (about 329 million inhabitents in 2018; GDP about US$ 19.4 trillion in 2017). The USA is rich in oil and coal deposits and is the world leader in the mining of lead and molybdenum (3rd place each), gold, copper and palladium (4th place each), zinc and platinum (5th place each). It is in 9th place for iron ore and 13th place for nickel. Fig. 11 shows the development of the USA‘s mining industry in the last 5 years. It can be seen that industrial minerals have experienced the largest increase, while metals and coal are going through a declining trend. Excluding the coal industry, approximately US$ 75.2 bn was generated in 2017.
3.2 The coal industry
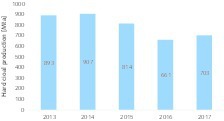
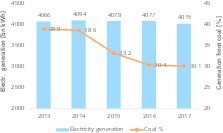
The coal industry in the USA stabilized in 2017, even though it no longer has the dominant role that it enjoyed in previous decades. Fig. 12 shows the mining output of hard coal. This has dropped from 907 million tonnes per year (Mta) in 2014 to 661 Mta in 2016. Support from the Trump government increased production to 703 Mta in 2017. For 2018, further slight increases are expected, resulting especially from growing exports. With electricity generation virtually unchanged, the share of hard coal in power production has fallen continuously right through to the end of 2017 (Fig. 13). After former shares of 56.7 % (1985) and 51.7 % (2000), the share of coal-fired power generation is still 30.1 %. From 2018 to 2020, another 3,422 MW of coal-fired generating plants will be shut down or converted to gas.
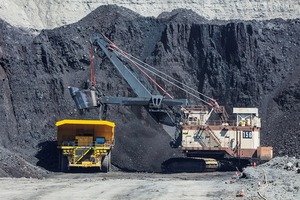
The largest company in the US coal industry, Peabody Energy, increased its production quantity in the USA from 142.3 Mta in 2016 to 156.7 Mta in 2017. Peabody owns 13 active coal mines in the USA, located in the Powder River Basin, Midwestern US and Western US regions. The largest and most productive mine is North Antelope Rochelle (Fig. 14), where 101.6 Mta of hard coal was mined in 2017 alone. With its mines in the USA and Australia, Peabody achieved a total production output of 188.3 Mta in 2017, up from 175.6 Mta in 2016. From April to December 2017, Peabody generated US$ 4.25 bn in revenue while its operating costs amounted to US$ 3.07 bn. The company‘s EBITDA for the period was US$ 1.15 bn. In the first quarter of 2017 it still had to absorb a loss of US$ 195.5 million.
3.3 Other important commodities
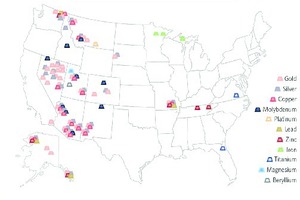
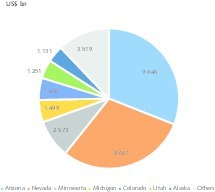
Fig. 15 shows the most important metals and the locations of the major mining operations in the USA. A large number of mines are involved in the extraction of gold, silver, copper, molybdenum and zinc. Most of the metal mining operations are located in the Midwest, particularly in the states of Arizona, Nevada, Minnesota, Michigan, Colorado, and Utah. These states together with Alaska account for 88 % of the mining industry‘s economic output (Fig. 16). The three major states are Arizona (31 %), Nevada (30 %) and Minnesota (9 %).
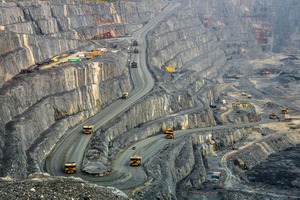
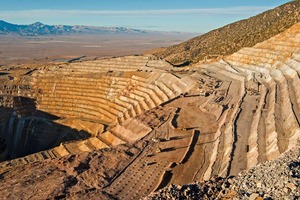
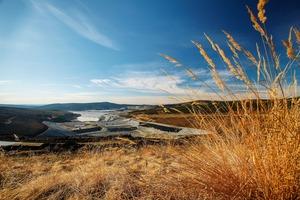
Gold mining output increased from 230 t in 2013 to 245 t in 2017, putting the USA in 4th place in the global ranking behind China, Australia and Russia. Barrick Gold, Newmont Mining and Kinross Gold are among the largest gold producers in the USA. Barrick Gold owns 3 mines in Nevada: the Cortez, Goldstrike and Turquoise Ridge mines (Fig. 17) and one mine in Montana: the Golden Sunlight. In 2017, the company produced 2.4 MOz of gold from its US mines. Newmont Mining owns 5 gold mines in the United States: Carlin, Phoenix, Twin Creeks, Long Canyon and Cripple Creek & Victor, and also holds a 25 % stake in Barrick Gold‘s Turquoise Ridge Mine. In 2017, Newmont Mining produced 2.211 MOz gold in the USA, after 2.024 MOz in 2016 and 1.643 MOz in 2015. In 2018, Kinross Gold produced about 1.51 MOz of gold in its 3 mines Fort Knox (Fig. 18) in Alaska and Rand Mountain and Bald Mountain in Nevada.
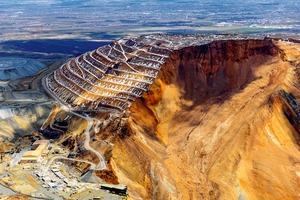
In the period 2013 to 2017, copper production in the USA increased only marginally to 1.27 Mta. In 2016, however, a peak value of 1.43 Mta was achieved. The market leader Freeport McMoRan owns 7 open-pit copper mines: Morenci, Bagdad, Safford, Sierrita and Miami in Arizona, and Chino and Tyrone in New Mexico. In 2018, the company produced a total of 0.637 Mta of copper in these mines after 0.689 Mta in 2017. Rio Tinto extracted 0.204 Mta of copper at its Kennecott mine in Utah (Fig. 19) in 2018, which was a 37 % increase on 2017. The increase was triggered by ore mining in a region with higher copper grades as well as by productivity improvements. Rio Tinto, in collaboration with BHP Copper and Resolution Copper, is planning another USA mine in the state of Arizona.
Lead is produced in 5 mines in Missouri and another 5 mines in Alaska and Idaho. In 2017, output quantities were still at 0.313 Mta after 0.370 Mta in 2015. Platinum group metals were produced in 2017 at a quantity of 0.0169 t by the Sibanye Stillwater Mining Company in 2 mines in Montana. Molybdenum is mined in the USA as the primary metal in 2 mines in Colorado, while 7 other copper mines, 4 of which are located in Arizona, produce the metal as a by-product. In 2017, the production quantity was 0.0446 Mta, compared to 0.0682 Mta in 2014. Zinc is extracted in 14 mines in 5 states. The production volumes most recently amounted to 0.73 Mta after 0.824 Mta in 2015.
4. Prospects
At the beginning of 2019, two acquisitions in the gold sector attracted attention. The American Newmont Mining Corporation is taking over the smaller Canadian rival Goldcorp for a price of about US$ 10 billion. This acquisition will make the North American company the largest gold producer in the world. The new company Newmont Goldcorp has a market value of US$ 28 bn and will produce approximately 7.8 MOz gold in 2019. Newmont Goldcorp will replace Barrick Gold of Canada as the largest company in the gold sector. As recently as September 2018, Barrick Gold had announced that it was buying Randgold Resources, a company listed on the London Stock Exchange, for US$ 6 bn. On January 2, 2019, the combined company went public on the NYSE and TMX exchanges with a market capitalization of US$ 22 bn.
Analysts assume that these two megadeals in the gold industry will not be the last of their kind. Consolidation is already more advanced in other mining sectors, such as iron ore, copper and nickel. The companies involved, such as Newmont Mining and Barrick Gold, report that the acquired companies offer potential for productivity gains and synergies. They anticipitate that the deals will place them in a better position for the future and, in particular, they expect to benefit from a larger expansion portfolio. Satellite-based exploration of mineral resources is also seen as an important factor in future developments.

