Combined evaluation of density and size effects of an air separation process using Mineral Liberation Analyses (MLA)
Dry air classification is a well-known technique used for decades in cement industry to separate material in the size range of 0.01 – 1.0 mm. Additionally, in corresponding dry grinding circuits with effective machines as High-Pressure Grinding Rolls (HPGR) the energy consumption can be reduced compared to wet applications. These dry systems are not state of the art in minerals processing plants but first prototypes have been installed and a raising number of projects is starting to evaluate this option.
One challenge in this field is the mineral composition of ores, which have by far a higher variety in density and size than those of cement. High density particles as iron containing ones have higher settling rates than low density silica particles of the same size. The main question to answer in this paper is how to evaluate this effect. Therefore, a quantitative method using Mineral Liberation Analyses was developed to calculate two-dimensional partition curves. Additional statistical analyses allow to isolate and quantify the interaction of density and size. This enables engineers to consider this effect for the sizing of process plants. The paper will present the method and selective results for a compounded ore of iron and silica.
1 Introduction
The liberation size of ores decreased within the last decades and calls for a reduction of the cut size of classification systems (Sousa et al., 2018). This trend will go on for future reserves as well (Jones and Boger, 2012). Dry screens are technical limited to perform this task. In addition, the availability and costs of water for spiral separators, wet screens or hydro cyclones is a major concern for plants, especially in dry mining zones (e. g. Chile, Peru, Mauretania or Australia) (Ihle and Kracht, 2018).
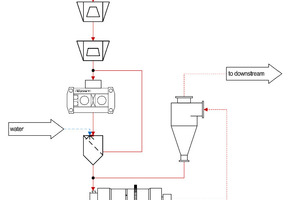
State of the art mining projects evaluate the application of HPGR technology versus SAG milling and other promising technologies (Costello and Brown, 2015; Baawuah et al., 2020). In many cases, the HPGR enables power savings and reduces the load in the downstream ball mill. This has been successfully proven in test work and real industrial applications (Gardula, 2015; Vanderbeek and Gunson, 2015). Fig. 1 represents a standard circuit with HPGR and screen in front of a ball mill.
According to the Bond theory (Bond, 1952) and its calculations for HPGR application (Heinicke and Hubert, 2019) the transfer size from HPGR/screen circuit to ball mill is influencing the ball mill performance. Minimizing this transfer size reduces the total energy consumption for grinding due to the higher energy efficiency of the HPGR compared to the ball mill (van der Meer and Schnabel, 1997) and creates a higher circulating load within the HPGR grinding circuit. Additional physical effects like micro-cracks reduce the energy consumption of the ball mill even more (Michaelis, 2005; Bru et al., 2020).
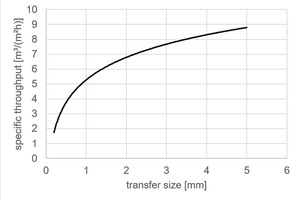
In general, the performance to separate material by screens decreases with lower transfer or cut size (Fig. 2). This effect is due to smaller screen openings, reduced relative open cross-section and lower specific throughputs (volumetric limited), and can be countered by an increase of screen area. As mechanical restrictions and the high acceleration in modern screens are limiting the screen areas, the number of screens has to be increased at a certain point. An increase in number raises further questions in the flow sheet design, for example of how to distribute homogenously material to many screens.
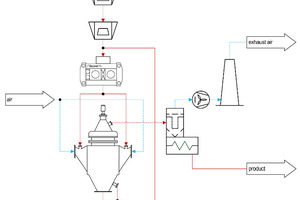
The above mentioned challenges with respect to fine particles (i.e. in the lower µm-range) have already been addressed in the cement industry (Aydogˇan et al., 2006). The highest energy savings were attained by finish grinding applications according to Fig. 3, where grinding is done in a HPGR and the low cut size is established by air classifiers. As the application of wet sieving is avoided, there is no requirement for high water consumptions in the process.
The cut size in air classifiers depends on the flow regime of the air and the particle properties including size and density (Shapiro and Galperin, 2005). Depending on the necessary degree of liberation, very fine cut sizes (e.g. P80 of 0.03 mm) can be achieved for dynamic air classifiers by a low air throughput and high rotational speed of the classifier wheel (Altun et al., 2016; Guo et al., 2007). Additionally, to a defined and narrow size distribution, two-stage air classifiers can produce medium-size product streams, which enable to use additional separators (e.g. magnetic separation devices). This opens up the potential for additional enrichment in the circuit (van der Meer, 2011).The enrichment with two-stage air classifiers can be positive when looking at the valuable mineral (e.g. iron content increases for downstream processing) or negative when looking at abrasive minerals (e.g. silica content increases in circulation loads). All those effects have to be evaluated, as the composition of minerals in ores is by far more complex than in cement applications.
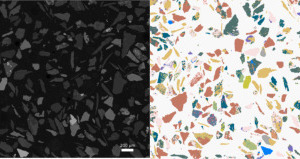
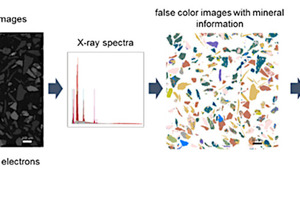
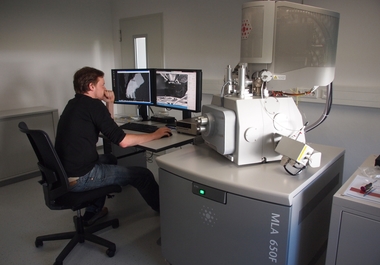
One modern way to characterize mixtures of minerals is automated mineralogy or mineral liberation analysis (MLA). MLA generates particle based information on the basis of scanning electron microscopy (SEM) combined with an energy dispersive X-ray sensor (EDX) of particle cross sections (Fandrich et al., 2007). In detail, the total area of the cross section and the partial areas of the individual mineral phases in the cross section are determined for each particle. Together with a database of the individual mineral densities, the respective particle density can be calculated as weighed average value. Those basic properties can be combined with other particle properties like characteristic sizes or susceptibility (Buchmann et al., 2018a), which gives a matrix of particle information. Fig. 4 shows a schematic representation of the workflow from the particle sample to particle-based information via MLA. This or equivalent methods enable a multidimensional characterization of product and tailing streams as evaluation of e.g. separation processes as a function of different particle properties (Buchmann et al., 2020; Schach et al., 2019).
Since the particle information from MLA is based on a 2D evaluation some stereological bias might occur when transferring it to 3D parameters (Ueda et al., 2018). The particle information matrix of MLA can be used to identify the most important properties for a certain separation process (Buchmann et al., 2018b). In the following sections the multidimensional characterization via MLA will be presented with the example of an air classification process of a certain iron oxide material.
2 Materials and Methods
The evaluation has been based on air classification test work, MLA analysis and special post processing.
2.1 Air Classification
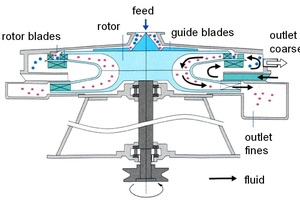
A Turbo Classifier TC-15M manufactured by Nisshin Engineering was used for classification (Fig. 5). This classifier represents a dynamic counter current air classifier equipped with a classifier wheel, which utilizes a centrifugal field with forced eddy flow. The rotational speed of the wheel, the airflow rate and the feeding rate can be adjusted in order to get cut sizes between 1 and 100 µm. The tests shown here were conducted at an air flow rate of 2.2 m3/min at various rotor speeds in order to get theoretical cut sizes between 35 and 90 µm. These theoretical cut sizes were calculated according to the classifier calibration algorithm, which considers the average particle density. In turn, the density was determined to 4.0 g/cm3 measured by Helium pycnometry (AccuPyc II 1340, Fa. Micromeritics).
The applied feed material represents an iron ore with a particle size distribution < 250 µm. According to MLA, the main minerals of this material are Fe-oxides (mass fraction of 65 %), silicates (30 % of mass) and some other minerals with minor contents (e.g. carbonates). Each test and measurement was performed with representative samples of the feed material (700 to 750 g) or classification products (130 to 630 g). Conventional riffle splitters or rotational splitters were used to produce analytical samples by standard procedures.
2.2 Evaluation of MLA Results
Polished epoxy blocks of the samples from the air classification tests with a diameter of 30 mm were prepared. The sample material was mixed with graphite for a better separation of the particles and then embedded in epoxy resin. The resulting block was cut in slices, turned by 90° and embedded in epoxy again. Thus, for further investigations on the sample surfaces via Mineral Liberation Analysis (MLA) any separation effects due to gravitational settling of the particles were minimized. MLA is an automated SEM-based image analysis method, comprising a scanning electron microscope FEI Quanta 650F equipped with two Bruker Quantax X-Flash 5030 energy-dispersive X-ray spectrometers and the MLA 3.1.4 software suite for automated data acquisition. All samples were analyzed using the grain X-ray mapping (GXMAP) mode (Fandrich et al., 2007). Standard spectra were collected for all relevant minerals (Bachmann et al., 2018).
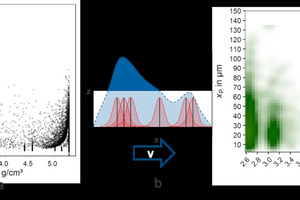
The discrete information coming from MLA on a particle level can be transferred to a continuous representation by the method of kernel density estimation (Schach et al., 2019; Kupka et al., 2020). In Fig. 6a the particles of the feed material for the air classification tests are shown regarding their property combination of size xP and density ρP. Each dot represents one particle found in exactly this MLA sample. Every MLA measurement can be represented by a likewise manner. The kernel density estimation generates a Gaussian kernel around each data point (particle) and a hull curve for all data points (particles) by overlapping these kernels. This concept is visualized in one dimension (x) in Fig. 6b. By weighting the kernels with the respective mass of each particle, the mass distribution is achieved as a function of two characteristic particle properties (particle size xp and particle density, see Fig. 6c). The equivalent circle diameter (ECD) is used as size parameter here, but any other 2D size parameter could be utilized. The following considerations are all based on particle size (xP) and particle density (ρP).
The resolution of the multidimensional representation is based on a kernel density estimation, which produces a continuous distribution. Nevertheless, a certain resolution has to be chosen for the visualization of the distribution like in Fig. 6c or the following. The presented resolution of 50 x 50 pixel is sufficient to identify certain material specific effects in the investigated example. The increase of calculation time which is necessary for a higher resolution was not reasonable for the actual example (Buchmann et al., 2020; Schach et al., 2019).
The mass distribution of the applied feed material (mineral composition in section 2.1) is visualized in Fig. 6c with the help of a color scale. The whole area sums up to 100 % of the particle mass and covers a size range from 2 to 150 µm and a range of particle densities from 2.5 to 5.5 g/cm3. Within these property ranges are preferred property combinations where most of the particles and therefore the mass of the feed material accumulates. Two main areas can be identified: a region at approx. 5.2 g/cm³ associated to Fe-oxide and a region at 2.6 – 3.2 g/cm³ mostly associated to silicates. These two areas represent more or less liberated particles where only one of these mineral groups is present. The intermediate densities between these two regions represent particles with more or less intergrown mineral phases.
Separation processes and especially classification processes are often evaluated by partition curves (or Tromp curves, T curves). For particles of defined properties (e.g. a certain size) the partition curve describes the probability to be transferred to a certain product (e.g. the coarse product of a classification process). Originally, these curves are based on one major property (e. g. particle size for classification processes) that influences most significantly the separation result. In this case, the partition curve is calculated and visualized as a function of this (single) major property.
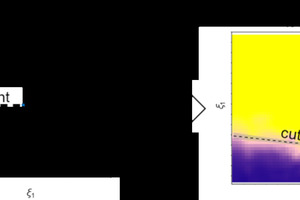
As already stated most separation processes are not only influenced by a single material property, but rather by a combination of different properties. With the kernel density estimation an extension of the one-dimensional partition curve to a two-dimensional partition map is possible. In Fig. 7 the expansion from such a 1D curve (based on one particle property ξ1) to a 2D map (based on two particle properties ξ1 and ξ2) is depicted. For visualization, the probability to be transferred is shown via colour scale in the 2D map.
The cut line represents a function of the particle properties ξ1 and ξ2. In analogy to the cut point in the 1D case it represents a regression line for the value of T in a range of 45 % to 55 %. From this perspective, a cut point is an average separation result regarding particle property ξ1 depending on the process as well as the composition of the feed material regarding particle property ξ2. Through partition maps, a direct assessment of the separation process as function of two or even more material properties is possible. The process result can be evaluated for multiple individual materials in the mix of the feed (in our case: particles of different densities and therefore also composition). The maps allow also to estimate the magnitude of influences from different material properties on the separation result like particle density or particle shape (not shown) in the case of air classification.
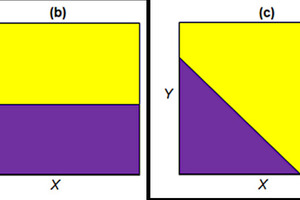
Based on the theory of partition curves as a function of one characteristic property there are ideal cases of such partition maps. These ideal cases are depicted in Fig. 8. The cases (a) and (b) describe a behavior, where the separation process is only depending on one of the investigated particle properties. Case (c) represents an example of a separation process depending on both properties. In (d) an ideal splitting is described with a constant value of T for the whole area. The ideal splitting equals two products with the same composition as the feed material regarding the property combination of X and Y.
Ideal cases show a behavior where the transition from 0 % to 100 % is represented by a step function. In reality (Fig. 10) there will be a transition zone between these two areas with values between 0 and 100 %. The extent of this transition zone defines the separation efficiency, i.e. the quality of the separation process. To minimize this zone will be the goal of process optimization and is closely related to the individual separation device. Another approach could be to minimize the amount of material associated to the corresponding combinations of particle properties by optimizing upstream processes like the grinding in an HPGR.
Following the approach of Schach et al. (2019) the separation efficiency for these partition maps can be assessed by calculating the statistical entropy for each size and density combination. The statistical entropy (H) is defined between 0 and 1. For an ideal separation process H will be 0, whereas an ideal splitting is characterized by H = 1. In practical applications the value for H will somewhere between these ideal cases. According to Buchmann et al. (2020) these established entropy maps (H-maps) are weighted with the mass distribution of the feed material (see chapter 2.3). In the following, this concept is used to compare the separation efficiency of the different air classification tests.
2.3 Calculation of T and H
A continuous mass distribution f is estimated via kernel density estimation with the help of the following equation:
⇥(1)
Here ωi represents a weighting factor (e. g. particle mass) for each particle i for the properties x and y (e. g. particle size and density). The kernels δx and δy can be chosen individually, but in the present case we chose for both a gaussian kernel. Further, the bandwidth bx and by represent a smoothing factor controlling the interaction of each data point. From these continuous distributions a partition curve can be calculated:
⇥(2)
Here m represents the mass of the individual stream. The T-value gives an indication if a certain particle with a distinct property combination is more like to be found in the one or the other product stream j (0 represents the feed stream). Based on these T values the entropy H can be calculated indicating a certain value of separation efficiency:
⇥(3)
And weighted with the respective feed material mass distribution an integral value for the assessment of the separation process is calculated:
⇥(4)
3 Results and discussion
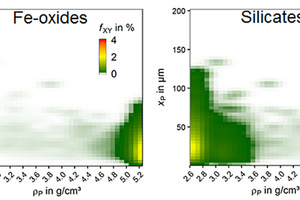
The classification tests are analyzed with the approach presented in section 2.2. The main components of the material are silicates and Fe-oxides. In addition, the distribution of these two mineral groups can be illustrated if the kernel density estimation is used only for the mineral mass of one specific mineral phase. In Fig. 9 this is done for the silicates and the Fe-oxides of the feed material. The mineral mass distribution for each depicted mineral group sums up to 100 %.
For the Fe-oxides, the majority of the mineral mass is in the range of the density value 5.2 g/cm³ and below a particle size of 100 µm. The particles in this range indicate high liberation of Fe-oxides as the particle density meets more or less the density of Fe-oxides (hematite and magnetite). Nevertheless, the mineral mass distribution of Fe-oxides also indicates Fe-oxides in lower density ranges. This corresponds to the mass of Fe-oxides more or less intergrown with other minerals.
A comparable situation appears for the silicates, which are mainly (83 %) quartz and actinolite. In comparison to the Fe-oxides, the silicates appear to some extent above 100 µm but with a majority below 100 µm. The majority of the mass of the silicates appears in a rather low density range (< 3.6 g/cm³), but there is also an amount of silicates containing particles at higher density values due to a low amount of minerals like enstatite (density up to 3.9 g/cm³) or silicate phase which are intergrown with Fe-oxides.
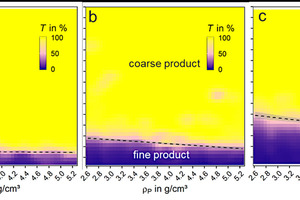
In Fig. 10 the partition maps of the classification tests of the presented feed material with three different cut sizes (theoretical cut size: a: 35 µm, b: 60 µm and c: 90 µm) are shown. For the assessment of the classification process, the partition map is used as presented in chapter 2.2. In Fig. 10 the probability of a particle to be transported to the coarse product is visualized with the help of a continuous color scales for the values between 0 % (purple) and 100 % (yellow). Two main areas are visible in three tests in Fig. 10: The yellow area shows an enrichment of the respective particle with these property combinations in the coarse product. The purple area is associated to low particle sizes and represents mainly a depletion of the respective property combinations in the coarse product. This is expected since small particles are mainly to be transferred to the fine product in a classification process. Between these two main areas a transition zone exists (with 0 % < T < 100 %) for which no clear assignment is possible whether the particle with this property combination will go to the coarse or the fine product. To increase the separation efficiency of the classification process, this transition zone needs to be minimized via process parameter adjustment as part of the typical process optimization.
The partition maps indicate the much stronger influence of the particle size on the classification process compared to particle density. Nevertheless, there is an influence of the particle density on the separation process visible. The cut size is shifted to lower values with increasing particle density. This effect is less pronounced in case a (35 µm cut size) and increases with increasing cut size. Nevertheless, the cut size is a function of the particle density and associated with the respective mineral group. For the heavy minerals (Fe-oxides in the range of 5 g/cm³) smaller particles are transferred to the coarse product compared to the lighter silicates.As a result, these minerals are over-ground, which reduces the energy efficiency of the comminution, and a tendency towards poorer sortability is to be expected.
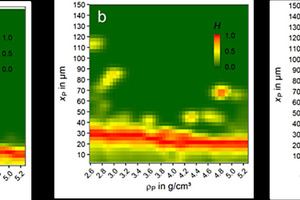
As already stated the calculation of the entropy for the results of a separation process is a good measure for the assessment of the separation efficiency. The H maps were calculated for the investigated air classification tests (Fig. 11). Based on these H maps the average entropy
, n is the number of pixels) ⇥(5)
and the average entropy weighted with the actual mass distribution of the feed material (Hw, see equation in chapter 2.3) were calculated (Table 1). The value Hm represents the mean value of the statistical entropy for the investigated property range. This value can be used to compare the separation efficiency of equally set property ranges. Here Hm slightly increases with increasing cut size. Consequently, the separation efficiency decreases with increasing cut size. This trend is in accordance with the H maps in Fig. 11b as it shows an increase of the red are (indicating high H values) with increasing cut size. For a direct reference to the actual feed material, Hw represents a global separation efficiency weighted with the mass distribution of the applied feed material (Fig. 11a). In this case the trend from Hm is confirmed and even amplified.
4 Conclusions and outlook
The application of SEM-based particle analysis (i.e. MLA) and the related post processing enables to evaluate the effect of the different particle properties on air classification. In the present case study, the combined effect of particle size and particle density was investigated. With the proposed approach, combined property effects are assessable to get a better understanding of the investigated process. Various other particle properties are accessible via MLA. Therefore, a huge variety of processes can be analyzed with the presented method as shown in Buchmann et al. (2020) and complete flow sheets can be assessed to characterize the different processes in a multidimensional approach.
The application of the statistical entropy enables a multidimensional assessment of the separation efficiency. Further, the applied characterization method via kernel density estimation and multidimensional partition maps is not limited to data from MLA, but is applicable to each particle-based data. The general approach to extend the influence of the size in separation processes can therefore deliver additional information to consider physical effects in design and optimization of processing plants.
Literature
Altun, Okay, Toprak, Alper, Benzer, Hakanand Darilmaz, Ozgun. 2016. ‘Multi component modelling of an air classifier’, Minerals Engineering, 93: 50-56, doi:10.1016/j.mineng.2016.04.014
Aydoğan, N. A., Ergün, L.and Benzer, H. 2006. ‘High pressure grinding rolls (HPGR) applications in the cement industry’, Minerals Engineering, 19: 130-39, doi:10.1016/j.mineng.2005.08.011
Baawuah, Emmanuel, Kelsey, Christopher, Addai-Mensah, Jonasand Skinner, William. 2020. ‘Economic and Socio-Environmental Benefits of Dry Beneficiation of Magnetite Ores’, Minerals, 10: 955, doi:10.3390/min10110955
Bachmann, Kai, Osbahr, Inga, Tolosana-Delgado, Raimon, Chetty, Deshenthreeand Gutzmer, Jens. 2018. ‘Variation in Platinum Group Mineral and Base Metal Sulfide Assemblages in the Lower Group Chromitites of the Western Bushveld Complex, South Africa’, The Canadian Mineralogist, 56: 723-43, doi:10.3749/canmin.1700094
Bond, F. C. 1952. “The third theory of comminution.” In Mining Engineering, 484-94
Bru, Kathy, Sousa, Rui, Leite, Mário Machado, Broadbent, Chris, Stuart, Garfield, Pashkevich, Dzmitry, Martin, Mirko, Kern, Mariusand Parvaz, Daniel B. 2020. ‘Pilot-scale investigation of two Electric Pulse Fragmentation (EPF) approaches for the mineral processing of a low-grade cassiterite schist ore’, Minerals Engineering, 150: 106270, doi:10.1016/j.mineng.2020.106270
Buchmann, M., Schach, E., Leißner, T., Tolosana-Delgado, R., Kern, M., Krupko, N., Rudolph, M.and Peuker, U. 2018a. “Density and susceptibility: Geometallurgical characterization of a cassiterite-bearing complex skarn ore from the Ore Mountains, Germany.” In 29th International Mineral Processing Congress, Moscow, 4042-50
Buchmann, M., Schach, E., Tolosana-Delgado, R., Leißner, T., Astoveza, J., Kern, M., Möckel, R., Ebert, D., Rudolph, M., van den Boogaart, G.and Peuker, U. 2018b. ‘Evaluation of Magnetic Separation Efficiency on a Cassiterite-Bearing Skarn Ore by Means of Integrative SEM-Based Image and XRF–XRD Data Analysis’, Minerals, 8: 390, doi:10.3390/min8090390
Buchmann, Markus, Schach, Edgar, Leißner, Thomas, Kern, Marius, Mütze, Thomas, Rudolph, Martin, Peuker, Urs A.and Tolosana-Delgado, Raimon. 2020. ‘Multidimensional characterization of separation processes – Part 2: Comparability of separation efficiency’, Minerals Engineering, 150: 106284, doi:https://doi.org/10.1016/j.mineng.2020.106284
Costello, B.and Brown, J. 2015. “A tabletop cost estimate review of several large HPGR projects.” In Proceedings of SAG (Vancouver), 1-24
Fandrich, Rolf, Gu, Ying, Burrows, Debraand Moeller, Kurt. 2007. ‘Modern SEM-based mineral liberation analysis’, International Journal of Mineral Processing, 84: 310-20, doi:10.1016/j.minpro.2006.07.018
Gardula, A. 2015. “First year operation of HPGR at Tropicana Gold Mine.” In Proceeding of SAG (Vancouver)
Guo, Lijie, Liu, Jiaxiang, Liu, Shengzhaoand Wang, Jinggang. 2007. ‘Velocity measurements and flow field characteristic analyses in a turbo air classifier’, Powder Technology, 178: 10-16, doi:10.1016/j.powtec.2007.03.040
Heinicke, F.and Hubert, A. 2019. “Improvement of CIS standard iron ore circuit by HPGR.” In Proceedings of SAG (Vancouver), 1-10
Ihle, Christian F.and Kracht, Willy. 2018. ‘The relevance of water recirculation in large scale mineral processing plants with a remote water supply’, Journal of Cleaner Production, 177: 34-51, doi:10.1016/j.jclepro.2017.12.219
Jones, Hughand Boger, David V. 2012. ‘Sustainability and Waste Management in the Resource Industries’, Industrial & Engineering Chemistry Research, 51: 10057-65, doi:10.1021/ie202963z
Kupka, N., Tolosana-Delgado, R., Schach, E., Bachmann, K., Heinig, T.and Rudolph, M. 2020. ‘R as an environment for data mining of process mineralogy data: A case study of an industrial rougher flotation bank’, Minerals Engineering, 146: 106111, doi:10.1016/j.mineng.2019.106111
Michaelis, H. 2005. “Real and potential metallurgical benefits of HPGR in Hard Rock Ore Processing.” In Proceedings of Randol Conference, 1-9
Schach, E., Buchmann, M., Tolosana-Delgado, R., Leißner, T., Kern, M., van den Boogaart, G., Rudolph, M.and Peuker, U. 2019. ‘Multidimensional characterization of separation processes – Part 1: Introducing kernel methods and entropy in the context of mineral processing using SEM-based image analysis’, Minerals Engineering, 137: 78-86, doi:10.1016/j.mineng.2019.03.026
Schubert, H. 2003. Handbuch der Mechanischen Verfahrenstechnik (Weinheim: Wiley VCH) ISBN 3-527-30577-7
Shapiro, M.and Galperin, V. 2005. ‘Air classification of solid particles: a review’, Chemical Engineering and Processing: Process Intensification, 44: 279-85, doi:10.1016/j.cep.2004.02.022
Sousa, Rui, Simons, Bethany, Bru, Kathy, de Sousa, Ana Botelho, Rollinson, Gavyn, Andersen, Jens, Martin, Mirkoand Machado Leite, Mário. 2018. ‘Use of mineral liberation quantitative data to assess separation efficiency in mineral processing – Some case studies’, Minerals Engineering, 127: 134-42, doi:10.1016/j.mineng.2018.08.004
van der Meer, F. P. 2011. “Feasibility of dry High Pressure Grinding and Classification.” In Proceedings of SAG (Vancouver), 1-18
van der Meer, F. P.and Schnabel, H. G. 1997. “The effect of roller press grinding on ball mill energy.” In Erzmetall, 554-61
Vanderbeek, J. L.and Gunson, A. J. 2015. “Cerro Verde 240.000 t/d concentrator expansion.” In Proceedings of SAG (Vancouver)
Authors:
Dr Markus Buchmann, German Aerospace Center (DLR) Cottbus/Germany
Markus Buchmann is a scientist at the Institute of Low Carbon Industrial Processes of the German Aerospace Center (DLR) in Cottbus. There he works in the Simulation and Virtual Design department on the decarbonisation of industry in Germany.
Dr Thomas Mütze, Helmholtz-Zentrum Dresden-Rossendorf, Helmholtz Institute Freiberg for Resource Technology, Freiberg/Germany
Thomas Mütze is a senior scientist at the Helmholtz Centre Dresden-Rossendorf (HZDR) and a member of the Processing Department of the Helmholtz Institute Freiberg for Resource Technology (HIF). His areas of expertise are grinding circuits, recycling technologies, silo design and bulk material behaviour. Since 2021, he has headed the Recycling research group at HIF.
Dr Felix Heinicke, Köppern Aufbereitungstechnik GmbH & Co. KG, Freiberg/Germany
Felix Heinicke is Senior Process Manager at Köppern Aufbereitungstechnik in Freiberg. He has been working in research and production for roller preparation for 15 years, including laboratory and industrial studies as well as installations for grinding and agglomeration around the globe.

