Strategies
Resource planning of the global players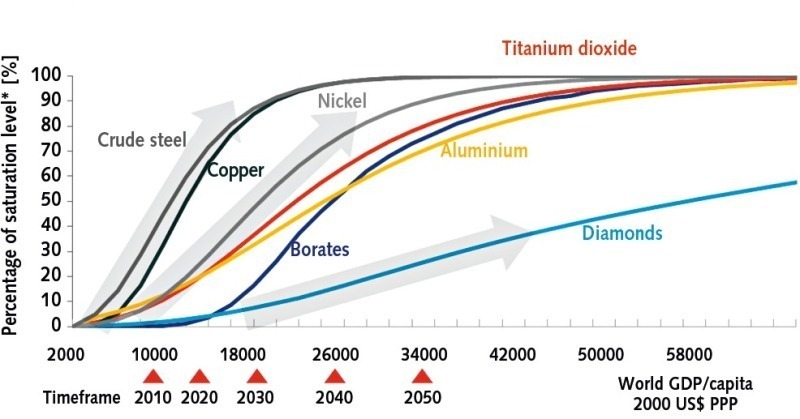 Quelle/Source: Rio Tinto
 Quelle/Source: Macquarie
 Quelle/Source: GlencoreXstrata, Vale
 Quelle/Source: De Beers
 Quelle/Source: AngloAmerican
 Quelle/Source: AngloAmerican
 Quelle/Source: BHP Billiton
 Quelle/Source: BHP Billiton
 Quelle/Source: BHP Billiton
 Quelle/Source: Xstrata
 Quelle/Source: Xstrata
 Quelle/Source: Rio Tinto
 Quelle/Source: Rio Tinto
 Quelle/Source: Rio Tinto
 Quelle/Source: Vale
 Quelle/Source: Vale
 Quelle/Source: BHP Billiton

Summary: The extraction of resources such as iron ore, coal, copper and other base metals will only reach saturation after 2020. On the other hand, the quality of the ores is steadily deteriorating and mines aren’t getting any younger, in fact they usually have a shorter lifetime than people. What this means for resource planning in the mining industry is discussed in the following with reference to examples. The strategies of the TOP players are also explained.
1 Introduction
In recent months, the clouds have been darkening over the mining industry. The reason is the falling prices for raw materials since the beginning of 2012, which is down to a lower demand in China. In 2012 alone, the achievable revenue for iron ore and metallurgical coal slumped by around 27 % compared to the previous year while the returns for nickel and copper fell by 21 % and 10 % respectively. Despite that, approximately the same quantities of materials have been produced in the last two years. For many materials, the downward trend in prices continued in the first six months of 2013. This development has not only hit the big mining companies, but threatened the existence of the “junior miners”, that is the young mining companies that do not have much equity and rely on borrowed capital for their exploration projects. This was shown especially on the Toronto Stock Exchange (TSX and TSXV), which lists around 50 % of the current 5000 worldwide exploration projects in its portfolio.
In 2012, via the TSX and TSXV, venture capital totalling 10.3 bill. C$ was made available to finance a total of 1700 projects, which corresponds to around 70 % of the worldwide injection of capital in the sector. Now the money for funding exploration projects has become much shorter. The inflow of funds at the TSXV slumped by 54 % from April 2012 to April 2013. The existence of many junior miners that had banked on higher raw material prices is now threatened. It is not yet possible to reliably gauge the impact that will have for global exploration projects. According to the well-respected Metals Economics Group (MEG), in 2012 the worldwide expenditure for exploration of non-ferrous metals rose by 3.3 bill. US$ (9 %) to 20.53 bill. US$, which corresponds to an all-time high. For 2013, however, spending on exploration is expected to fall significantly.
2 General conditions for resource planning
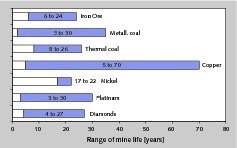
Following the boom of recent years, the demand for resources has now stabilized and remains on a high level. According to the forecasts of the mining companies, the demand for resources has not yet reached saturation by a long way (Fig. 1). Such assumptions are underpinned by the fact that the emerging countries, and above all China and India, have so far only reached a small part of the consumption of the saturated countries such as USA, Japan and Germany. The forecasts for China’s steel consumption expect saturation in the year 2030 at around 1000 million tonnes (Mt). China currently consumes 717 Mt. Consumption there is tied to, amongst other things, steel intensity in the construction industry. Whereas the share of steel in the five-storey buildings in 2004 stood at 20 kg/m2, only 10 kg/m2 is assumed for the modern seven-storey buildings today. With steel consumption, the demand for metallurgical coal or steel alloying components such as nickel and chromium is also growing.
Extraction of the resources, however, is becoming more and more complex and expensive [1]. According to a study of the MEG of 47 copper mines, which make up 40 % of the world copper production, the average copper content in the ore fell by 30 % from 2001 to 2012. But the copper content in new deposits is decreasing too. Whereas new copper deposits in the 1980s still contained 0.9 % copper, the copper content today tends towards 0.6 – 0.7 %. On the other hand, rich deposits are only found at greater depths or in regions that are very difficult to access, often with very unfavourable climatic conditions. In addition, production downtime as a result of strikes and power cuts has increased. And the approval of mining rights, stricter environmental legislation and not least rising duties and taxes deserve a special chapter.
As a result of this deterioration in conditions the average investment costs, for example, for new copper mines and processing plants have increased by 15 % annually over the last 20 years, with a marked increase registered specifically in the past five years. The operative costs for copper extraction have approximately tripled in the last 10 years and now amount to almost 3.3 US$/kg. It is therefore not surprising that the bigger mining companies have unanimously declared the goal of full spending discipline for new projects and resource planning. Unlike in earlier years, only such projects that boast acceptable size, lifetime and quality are approved. To achieve this, however, it has become much more difficult than it used to be. In many projects, the existing or necessary infrastructure for transport and shipping has become an important criterion [2].
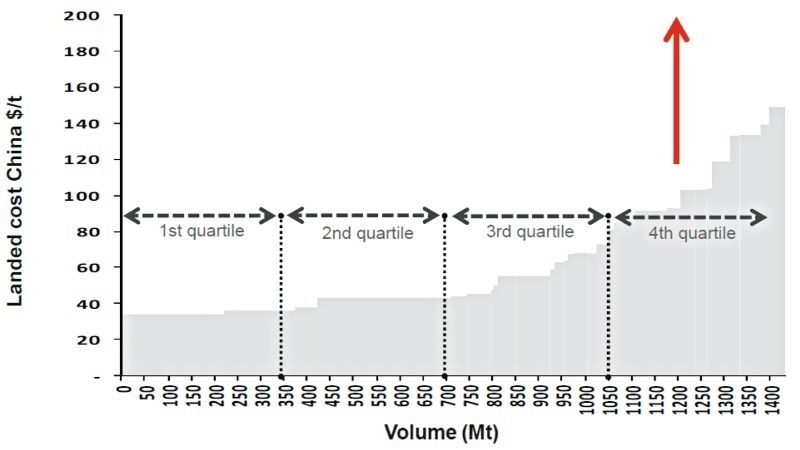
To accommodate the ever tighter cost structures and to remain competitive, mining companies today assess costs very carefully and benchmark them with comparable mining operations. Fig. 2 shows the cost curve for the production of iron ore shipped to China. The mines in the first quartile have the lowest costs and are the most competitive while the mines in the fourth quartile have the worst cost structure and, without additional measures, are not competitive. Depending on the market prices for iron ore, these mines can also suffer losses. Mining companies therefore endeavour to either close or sell such mines. In new planning, they try to achieve a cost structure that is at least in the second quartile. Corresponding cost curves are available today for practically all resource extraction operations.
3 TOP Players
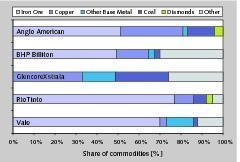
The resource planning of the TOP players in the mining industry is generally similar, but differs in detail. Fig. 3 shows the entire portfolio of the five enterprises examined here: AngloAmerican, BHP Billiton, GlencoreXstrata, Rio Tinto and Vale. The companies have a diversified portfolio, all apart from GlencoreXstrata with a dominant iron ore share. Only copper extraction and coal mining are conducted by all TOP mine companies. Diamonds are mined by AngloAmerican (De Beers) and Rio Tinto. “Other” covers a string of other mining activities like for example the oil business at BHP Billiton and GlencoreXstrata, the aluminium and minerals business at Rio Tinto or the fertilizer business (potash, phosphate) at Vale. The percentages shown in the image are based on the EBIT 2012 for the first four companies. For Vale, the percentages have been calculated from the sales figures for 2012.
In 2012 London-based AngloAmerican generated sales of 32.8 bill. US$. However, its EBITDA fell compared to the previous year by 35 % to 8.7 bill. US$ while its profits dropped by 44 % to 6.2 bill. US$. Reasons for the decrease in revenue were essentially falling prices – accounting for 3.9 bill. US$, inflation costs and strikes with an impact of 0.6 and 0.5 bill. US$. The production in 2012 increased by a factor of 0.2 bill. US, especially for iron ore, exported coal and nickel. Since 2007, the company has streamlined its portfolio, and today with iron ore/manganese, coal, copper, nickel, platinum, diamonds (Fig. 4) and others it has only just over seven significant resources segments. With this optimization of its portfolio, it was also important for the company to have more funds available in the segments it is focussing on.
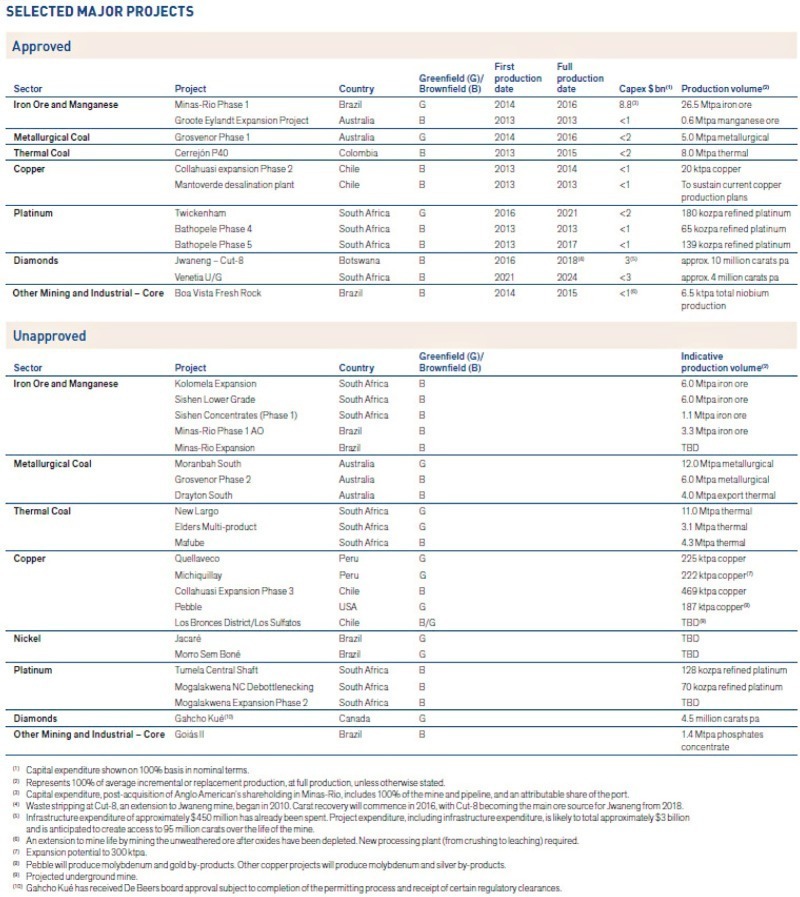
The remaining lifetime of the current AngloAmerican mines is shown in Fig. 5. The lifetime in years is calculated primarily from the proven reserves that can be extracted with the extraction methods and rates available today. For platinum the possible lifetime is longer, the 30 years are taken from the maximum term of the mining rights in South Africa. It can be seen that some of the resources in the mines – especially iron ore, metallurgical coal, copper, platinum and diamonds – can only be extracted for a relatively short period. To achieve roughly the same level of production in the years to come, early resource planning must be undertaken. Fig. 6 provides an overview of already approved projects and other projects still pending approval at AngloAmerican.
In 2012 AngloAmerican made investments totalling 5.7 bill. US$, slightly down on 5.8 bill. US$ in the previous year. The largest share of almost 37 % was channelled into iron ore projects, followed by 18 % each for projects in metallurgical coal and copper, 14 % went into the platinum segment. The De Beers Division (diamonds) accounted for just 2 % of the investments, for exploration costs only 0.1 % of the investments was made available. Most of the money was swallowed up by the Minas-Rio iron ore project in Brazil. The project is set to go into operation in the second half of 2014. An annual capacity of 26.5 Mt iron ore is planned for the first project phase. The processing plant had been completed to 53 % by the end of 2012. The project costs have increased from the originally estimated 5.8 bill. US$ to 8.8 bill. US$. The attractiveness of the project has since been questioned. Analysts have reported that AngloAmerican is seeking a project partner.
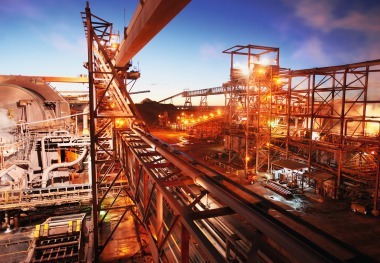
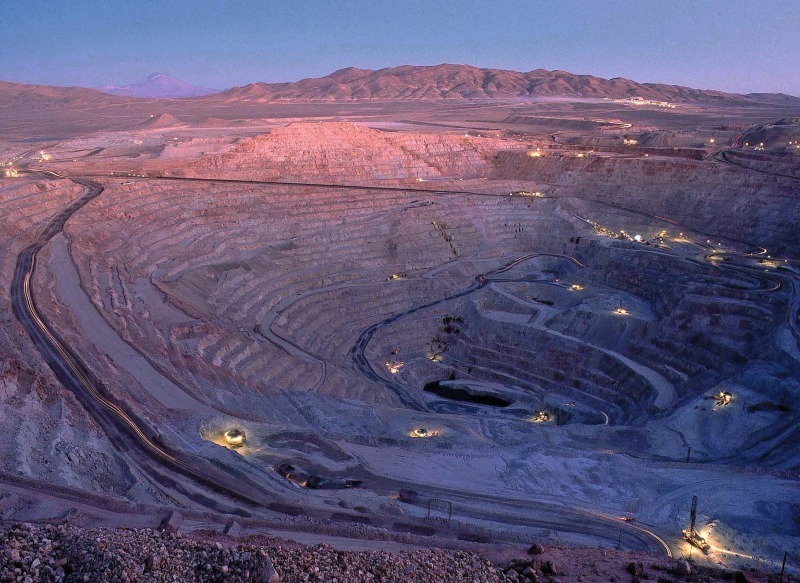
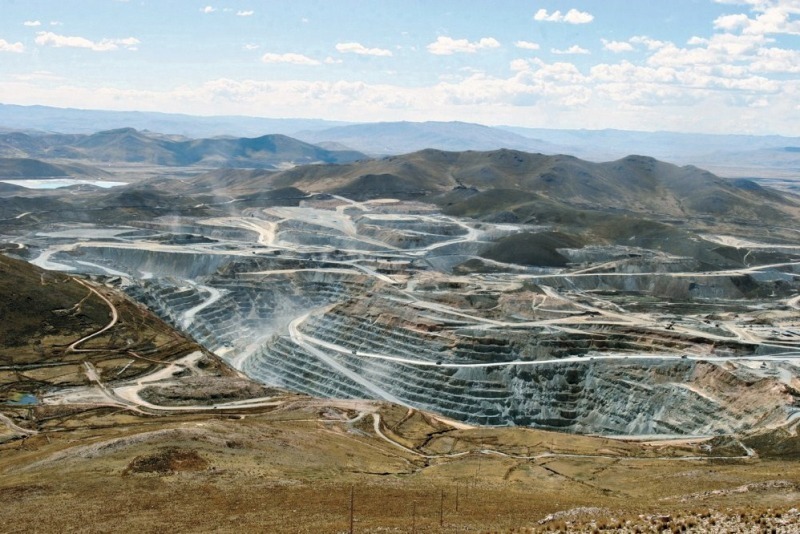
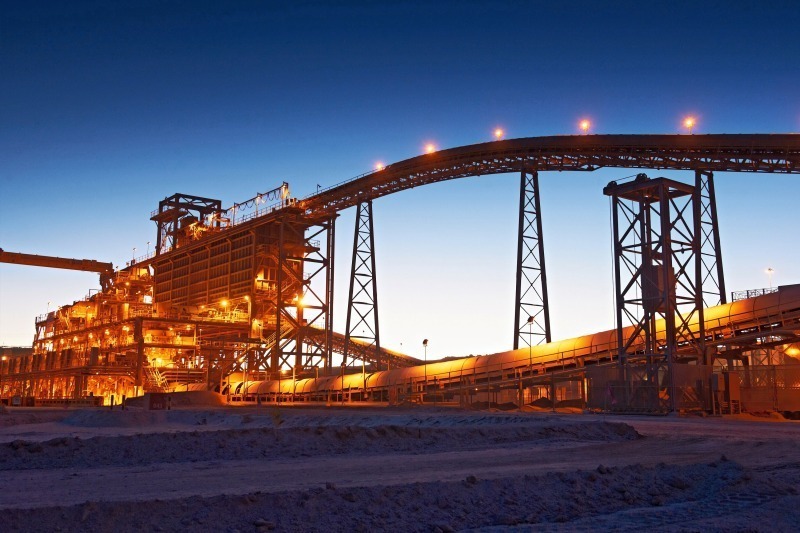
BHP Billiton, the Anglo-Australian mining group reported sales of 66 bill. US$ for the financial year 2013, which ended in June 2013, with its EBITDA falling by 16.9 % to 28.4 bill. US$ and its profits falling by 29.5 % to 10.9 bill. US$. Lower prices for the extracted resources were responsible for 8.9 bill. US$ alone in the EBIT. The company achieved record production rates in all segments – apart from nickel. Shipping of iron ore from Western Australia grew by 10 % to 189 Mt. Queensland Coal increased production by 19 % to 52 Mt and Escondida, the flagship copper mine in Chile (Fig. 7), achieved 28 % growth to 1.1 Mt. New record production levels were achieved for bauxite, aluminium and manganese too.
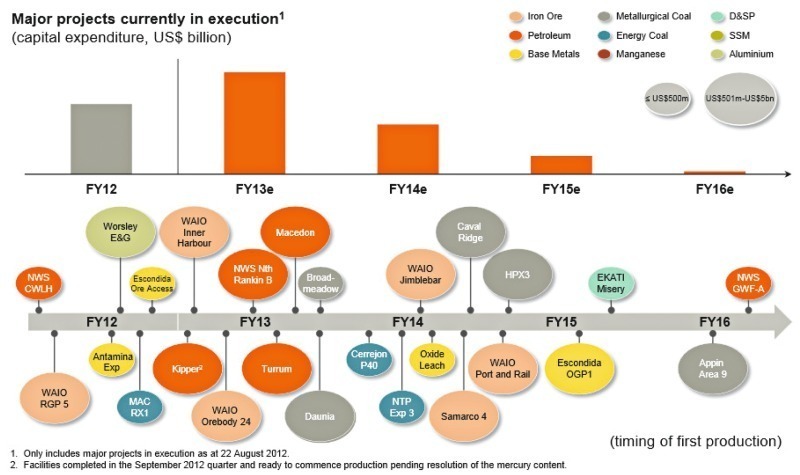
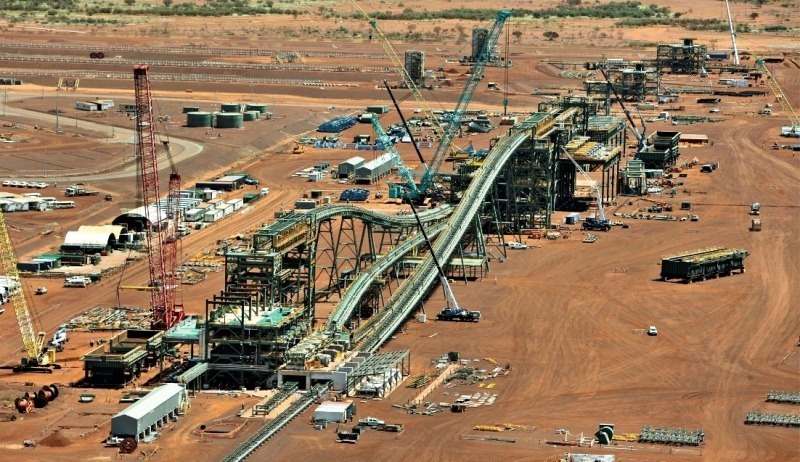
The group’s capital expenditure – without US on-shore investments – increased from 7.9 bill. US$ in the financial year 2007 to 19.0 bill. US$ in the financial year 2012. In 2013, expenditure has been scaled back to 17.4 bill. US$. Another 12.9 bill. US$ are planned for the financial year 2012. Exploration expenditure in 2012 and 2013 with 2.1 and 1.3 bill. US$ respectively took a share of 11 and 7.5 % of the investments. Fig. 8 shows the group’s planned investments and the project pipeline with the most important expansion projects (as of August 2012). The biggest investments are being made for iron ore, coal, oil and gas as well as copper and other base metals [3]. By 2016, diversification to potash extraction is planned. The high-ranking iron ore projects include the Jimblebar project (Fig. 9) in Western Australia, which will have a mining capacity of 35 Mt iron ore and go on stream in the first half year of 2014.
GlencoreXstrata currently employs 190 000 people worldwide. The company was established in May 2013 as the result of the takeover of Xstrata by Glencore. Unlike the other TOP companies, the management has an almost 25 % stake in the company via holding companies. GlencoreXstrata published its half-yearly report for 2013 in August. According to this report, sales totalling 121.4 bill. US$ were generated. The EBITDA fell by 9 % to 6.0 bill. US$ and the EBIT dropped by 28 % to 3.2 bill. US$. For the industrial activities in the mining sector the adjusted EBITDA fell by 4 % to 3.2 bill. US$ and the adjusted EBIT by 25 % to 1.5 bill. US$. Like the other TOP companies the lower earnings as a result of lower prices were partly offset by a higher output. According to information released by the group, the integration of Xstrata is already well advanced. However, for Xstrata value adjustments of 7.7 bill. US$ for goodwill and 0.5 bill. US$ for the processing plants have been made.
On account of the long-term nature of the projects, Xstrata’s project planning activities and mining operations (Fig. 10) will continue to exist for several years until Glencore’s priorites can be adapted accordingly. Glencore does not feel any pressure to grow for strategic reasons. Project decisions are marketing based and are developed and brought forward by the management teams. All projects are scrutinized with a bottom-up approach. Each project has to bring in a reasonable return and fit into the group’s portfolio. GlencoreXstrata focuses more on the brownfield projects or investments for the expansion of existing mines. The goal is to obtain a maximum return on minimum investment. Mines that don’t manage that are closed or sold off.
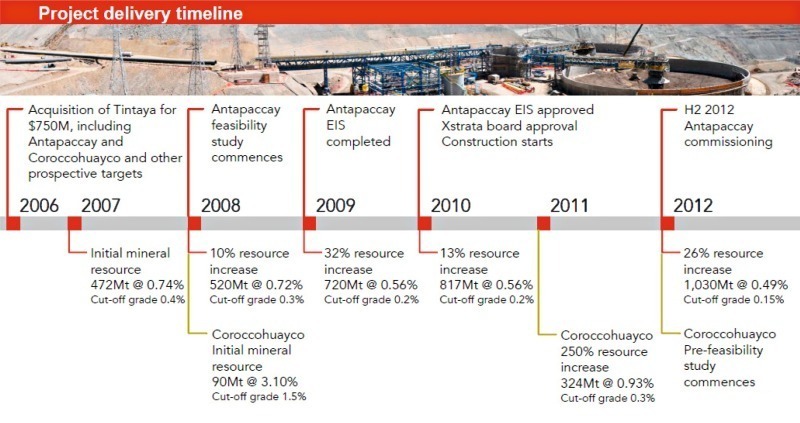
In 2007 Xstrata had concluded a 10-year alliance with the project development company Bechtel in the copper sector. It concerned amongst other things the development of a standard processing line for several projects in South America. The idea behind it was to save costs and time in the projects by replicating the developed solutions. Alliances or framework agreements were made with around 25 suppliers of crushers, mills to flotation cells. The first Xstrata-Bechtel project was the Antapaccay Project in Peru, which served as a blueprint for the copper mine projects Las Bambas in Peru and Lomas Bayas in Chile. The time schedule for the project is shown in Fig. 11. Antapaccay emerged from the Tintaya Mine, which was bought by Xstrata for 750 mill. US$ in 2006. Since then the mine has returned an EBIDTA of 2.5 bill. US$.
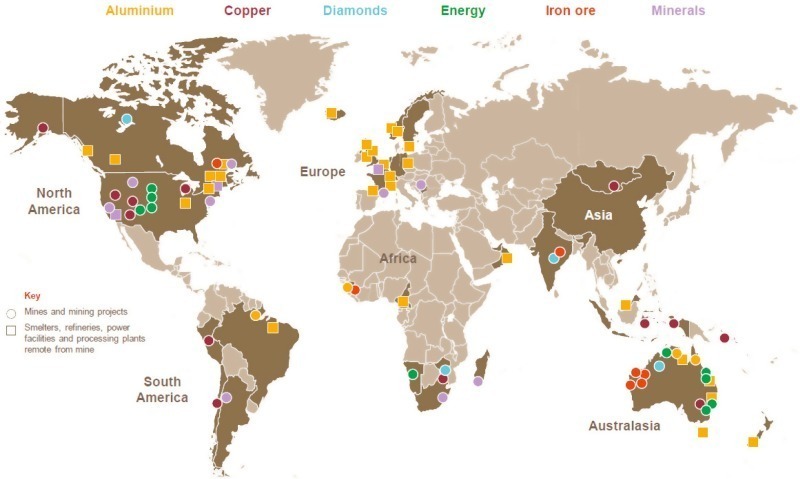
In 2012 Rio Tinto generated sales totalling 51 bill. US$, however, reported losses to the tune of almost 3 bill. US$, largely as a consequence of the lower market prices. But production levels in 2012 also fell slightly compared to the previous year. In the first six months of 2013 the price decline for company’s resources continued and the net earnings fell by 71 % to 1.7 bill. US$ compared to the half-year period of 2012. Nevertheless the company considers itself in a good position, with a stronger portfolio (Fig. 12) than in previous years. In the first six months of 2013 total cost savings of 1.5 bill. US$ could be made thanks to various structural measures. With these measures, operating costs could be cut by 9 %. The portfolio includes a very wide range of mining activities from iron ore, through coal, uranium, diamonds, copper and minerals such as titanium dioxide and borate.
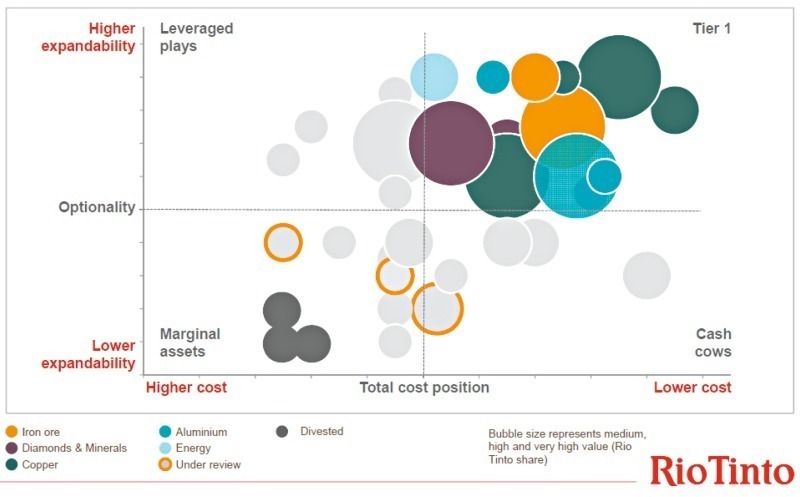
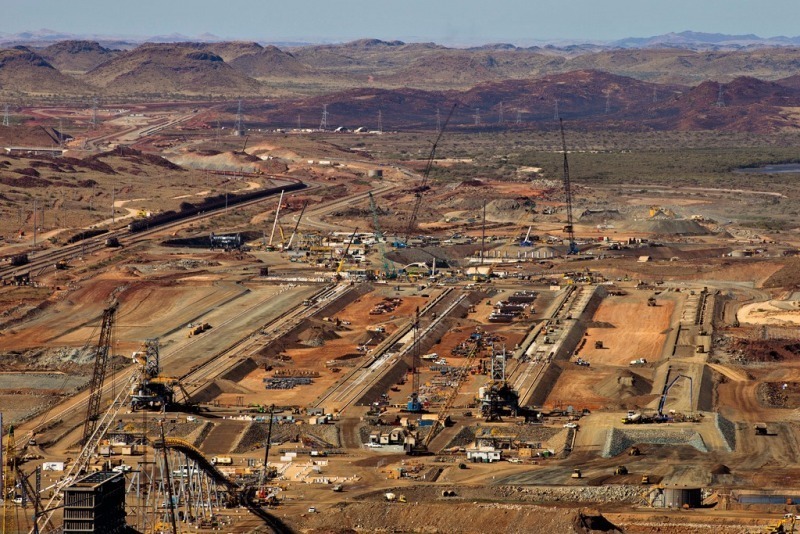
Investments in 2012 reached the highest level with 17,5 bill. US$ after 12.3 bill. US$ in 2011 and 4.6 bill. US$ in 2010. For 2013 expenditure in the order of 14 bill. US$ is planned. In the following years, investments will decrease to below 10 bill. US$. The company continues to pursue the goal of owning very high-ranking mines (Fig. 13, Tier 1). The outstanding mine projects currently realized include the Oyu Tolgai copper mine in Mongolia and the expansion of the Pilbara iron ore mine (Fig. 14) in Western Australia. For Phase 1 at Oyu Tolgai, which has now gone into operation, 6.2 bill. US$ were estimated. Pilbara 290 and Pilbara 360, which are increasing the iron ore capacity of Rio Tinto in Pilbara from 237 Mt at present to 290 Mt and 360 Mt annually, have been estimated at 9.7 and 5.5 bill. US$. Other big mining projects are located in Guinea with the Simandou iron ore project and in Mozambique with one coal project [2].
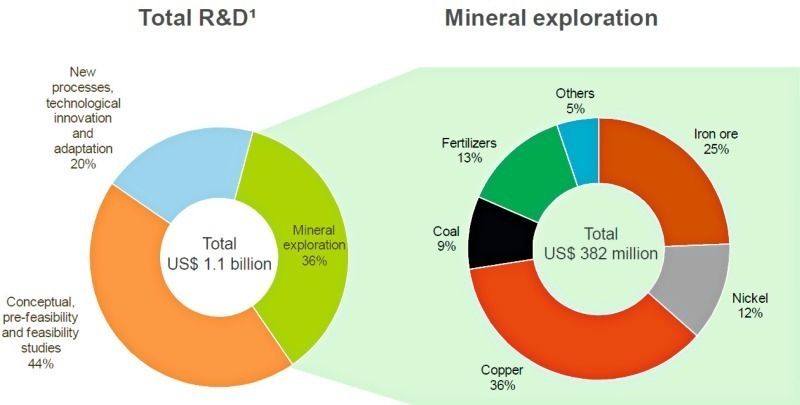
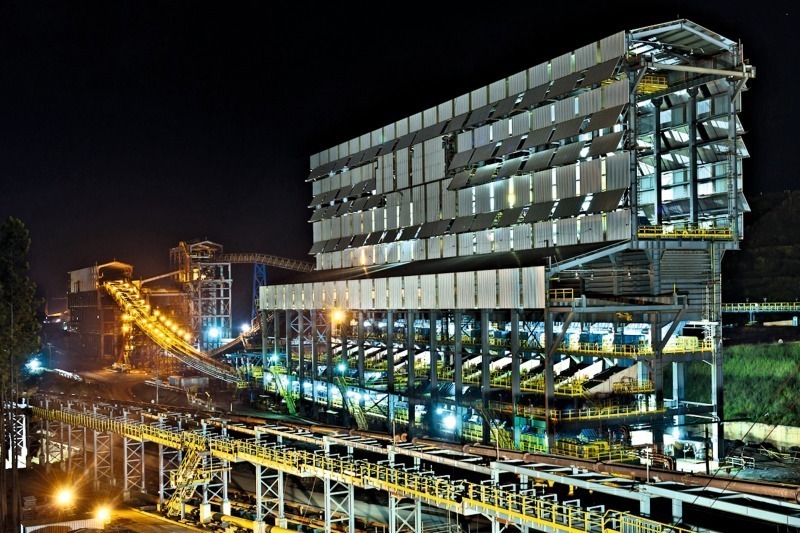
In 2012 Vale generated sales totalling 47 bill. US$, which meant losses of 21.7 % on the previous year. An above-average high share of the losses, 26 %, was reported by the Bulk Materials Division, which at Vale is responsible for the extraction or iron ore, iron ore pellets, manganese and ferroalloys as well as coal. In 2012 this sector still generated 74 % of the sales, the base metals copper and nickel accounted for 15 % while potash and phosphate fertilizers made up 7.5 %. The company’s spending on research and development amounted to 1.1 bill. US$ (Fig. 15). This breaks down into 20 % for improvements to processes and technologies, 44 % for feasibility studies for new projects and 36 % or 0.4 bill. US$ for exploration. The exploration expenditure is just about evenly distributed over the portfolio, copper with 36 % and iron ore with 25 % alone making up 60 %.
In the years from 2009 to 2011 investments were steadily doubled from 9.0 bill. US$ to 18 bill. US$. In 2012, capital expenditure still totalled 17.7 bill. US$, the main shares of 8.5 bill. US$ and 4.2 bill. US$ being consumed for iron ore and base metals respectively. The sustaining CapEx, i.e. capital expenditure to sustain operations, amounted to 5,0 bill. US$ and therefore makes up around 5 % of the Vale assets. Around 50 % of the sustaining capital expenditure is used for replacing equipment. Following many brownfield projects in recent years, Vale is now switching more to greenfield projects as these promise higher profits. By 2017 it wants to achieve a production output of 400 Mt iron ore following 306 Mt in 2013. This is to be realized essentially with the new Carajas and Conceicao projects (Fig. 16). Conseicao is set to generate 12 Mt iron ore with an investment of 1.2 bill. US$. At Carajas, in the first phase of the project, for an investment of 4.1 bill. US$, 40 Mt are to be achieved in the second six months of 2013. The second phase is to increase capacity to 90 Mt in the second half of 2016.
4 Outlook
The mining industry surprises with huge investments, hitting the 10 bill. US$ mark for some individual projects or triggering annual investments in the order of 15-20 bill. US$ for individual companies in recent years. Obviously there has been a run on the last world-class mines. The corporate goals and priorities are set out accordingly. On the other hand, the companies have announced substantial cuts in capital expenditure budgets for such projects in the next few years. This may be linked with 2012 showing how just vulnerable the mining industry is and how severely prices can impact profits. But the production figures didn’t even slump in 2012. In the view of the mining industry, this will only happen after 2020. The question is what will happen up until then. With the limited budgets, the run on the world-class mines will probably come to an end.