Company insights
Rare earths, heavy mineral sands, niobium and tantalum as well as the battery raw materials lithium and cobalt are some of the critical resources that are subject to a high supply risk. A lot is written about from where these materials are sourced, but only limited information is available on the companies engaged in the extraction of these resources. Which companies are they and how cost efficient is their extraction. This article provides some answers.
1 Critical resources – a situation analysis
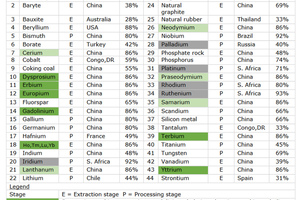
Hardly any other topic is the subject of so many reports as critical resources. These are mineral resources of key economic importance but subject to a high supply risk. Reliable and assured access to these resources is a critical issue not only for us, but all over the world. In the EU, since 2011, a list of these critical resources has been compiled. This list is reviewed every three years and updated as necessary [1]. The current list comprises 44 critical resources (Fig. 1), instead of 30 if a differentiation is made between heavy and light rare earths (HREE and LREE) and platinum group metals (PGM). This list clearly shows that there are heavy dependences on just a few countries, not only for their mining, but also with regard to their downstream processing or smelting.
Whereas for the supply of critical resources, the EU is relying on the increased use of trade instruments like, for example, free trade agreements and greater cooperation with international organizations to assure sustainable and responsible supply of resources, other market players have chosen a much more direct course of action. Chinese companies have long received state support to assure the supply of resources from countries outside China, too [2]. For that reason, we can no longer look at the assured supply of raw materials based on purely country-specific criteria. The point is that in many countries assurance of raw materials supply has been shifted to the producing mining companies. A development that is not only visible in China, but which also applies to companies from Australia, Canada, the USA and Japan.
2 Rare earths
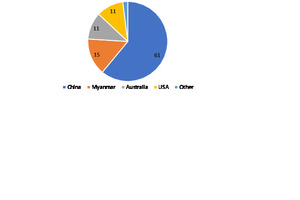
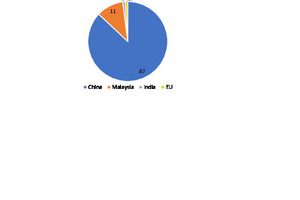
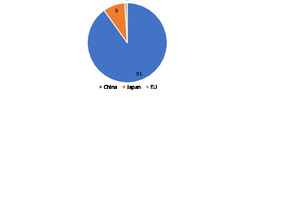
In the market for rare earth elements (REE), China has so far had a monopoly, especially if you include the processing sector [3]. Fig. 2 shows the currently most important countries in the supply chain, from extraction and concentration through processing and refining to the production of permanent magnets, probably the most important sales market for REE. China tops this list also for mining with around 61 % of the worldwide quantities in 2021, followed by Myanmar, the USA and Australia. All other countries have so far only made up just 2 % of mining, even if some of the largest deposits are located in countries like Brazil, Russia and Vietnam. In the value creation chain, for mineral processing and smelting China has achieved an 87-% market share, and for the production of NdFeB permanent magnets, where especially neodymium is a significant factor, the country has market shares above 90 %.
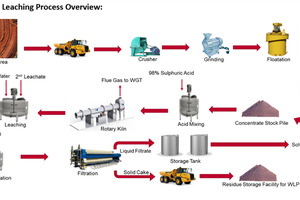
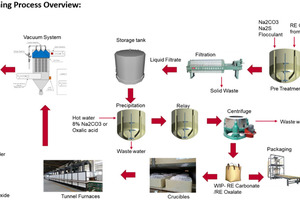
In recent years, China has steadily increased its production quotas for REE minerals. In 2022, the quota was increased to 210 kilotonnes (kt), that corresponds to an increase of 25 % in 2021. As the extraction of the rare earth elements from the minerals is very complex and expensive, for many years, environmental and health hazards in the extraction and processing of the rare earths were disregarded in China. Examples from Australia and the USA demonstrate how the extraction of rare earth elements can be cost-efficient, but at the same time comply with strict environmental regulations. Fig. 3 and Fig. 4 show the processes for concentration of the minerals and for the production of REE oxides and REE carbonates. In between is the complex process of solvent extraction. This gives an indication of the technologies applied for rare earths.
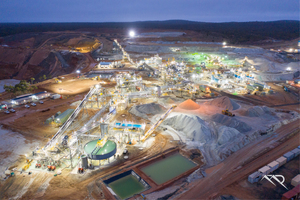
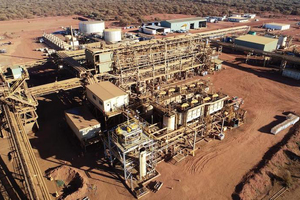
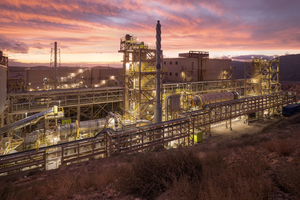
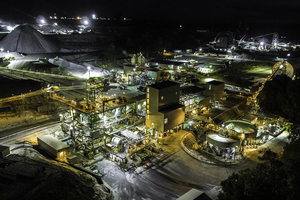
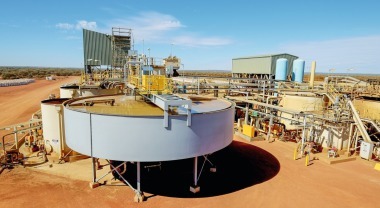
An insight into the economic significance and cost efficiency of the extraction of rare earths is provided by a current report by PE Research commissioned by Lynas Rare Earths. Lynas mines ores for rare earths at Mt. Weld in Western Australia. The mine and concentration plant (Fig. 5) have been in operation for ten years. Mt. Weld has 18.9 mill. t ore reserves with a content of 8.3 % TREO (total REE oxides). In 2021, Lynas produced 16.405 t REE oxides, and with sales of almost 500 mill. A$, it generated a profit of 157 mill. A$. Around 500 mill. A$ are being invested in the expansion of Mt. Weld. The capacity for the extraction of neodymium and praseodymium products (NdPr) for the production of heavy-duty magnets there is to be doubled to 12 kt. Lynas is increasing its processing capacity in Kalgoorlie in Western Australia. In addition, Lynas has refinery capacities in Gebeng in Malaysia.
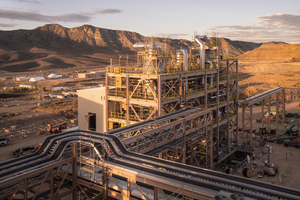
In 2022, MP Materials extracted just under 42.5 kt REE concentrate from its Californian Mountain Pass Mine. From the sale of the concentrate (Fig. 6), it generated 527.5 mill. US$ in turnover. MP Materials now supplies around 15 % of the rare earths worldwide and is also focussed on NdPr production, with sales cooperation with Sumitomo Corporation for the Japanese market. The company is currently expanding its downstream production technologies to offer a complete supply chain solution for REE concentrates through comminution (Fig. 7) and refining of REE oxides to the production of NdPr magnets. The second development stage with the extraction of different REE products was completed in 2022, the final 3rd stage is scheduled for 2025.
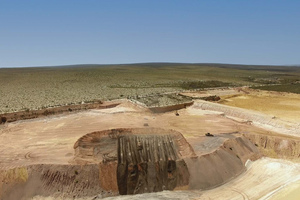
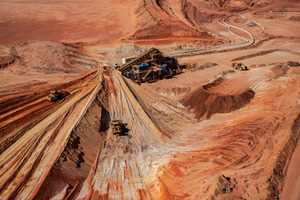
Although the hurdles for entry into the production of REE products are very high on account of the necessary and complex technologies, there is currently a string of development projects. At its Eneabba site in Western Australia, Iluka Resources has over 1 mill. t extracted mineral sands (Fig. 8), which are rich in REE. Iluka plans there a processing plant for the mineral sands with an integrated refinery for the production of REE products for 17.5 kt initially and then 22.5 kt once the facilities reach full capacity. For the project, loans totalling 1.25 bill. A$ have been granted by the Australian government. Phases 1 and 2 of the project with the processing plant are on the verge of completion, the refinery is to be ready for operation in 2025. Iluka can supply more raw material for REE processing from its mines in Balranald and Wimmera.
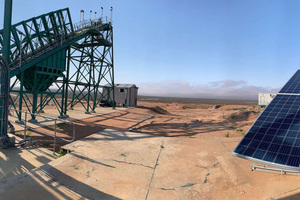
With projects in South Africa, Namibia, Malawi and Angola, Africa could also profit from the rare earth boom. In the Steenkampskraal Monazite Mine (Fig. 9) in the Western Cape Province in South Africa, there are 0.605 mill. t ores with an average REE content of 14.36 % or 86.9 kt REE. The Lofdal Project of Namibia Rare Earth (NMI) is already further advanced. In Bannerman Energy and JOGMEC (Japan Oil, Gas and Metals National Corporation), high-ranking investors have been found. JOGMEC had already taken a stake in Lynas. The Songwe-Hill project of the Canada-based Mkango Resources is also very promising. And the Australian company Pensana is pressing ahead with its Longonjo project in Angola.
3 Heavy mineral sands
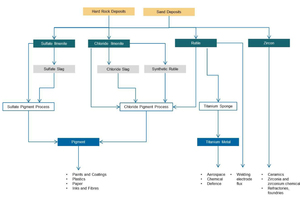
The critical resources rutile and zirconium are both heavy mineral sands. Fig. 10 shows an overview of the key mineral sands and their use. In 2021, around 1.2 mill. t zirconium as well as around 0.5 mill. t high-purity rutile and 0.7 mill. t synthetic rutile were produced. If the production of 1.3 mill. t TiO2 from chloride slag is included, then this adds up to a total of 2.5 mill. t “high-grade” TiO2. The highest prices for these products are not obtained in the production of TiO2 pigment, but in the production of titanium metal and zirconium. While zirconium obtains prices of over 2000 US$/t, for “high-grade” rutile, prices reach 1500 to 1600 US$/t, while the prices for titanium in 2022 climbed to over 19 000 US$/t. Titanium is 45 % lighter than steel but just as strong, withstanding corrosion in seawater and being resistant to high temperatures.
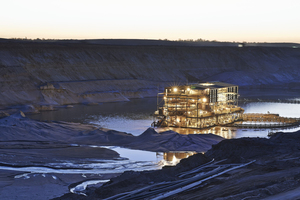
Worldwide, only a relatively small number of companies produce the metals rutile and zirconium [4]. The market leaders include Iluka Resources. In 2021, the group of companies, to which Sierra Rutile also belongs, generated a turnover of around 1.5 bill. A$ and achieved market shares of 38 % for rutile, 26 % for synthetic rutile and 28 % for zirconium. Iluka‘s mining operations and processing plants are located at several sites in Southern and Western Australia. The Jacinth-Ambrosia Mine (Fig. 11) is the world’s largest zircon mine. The Narngulu processing plant near Geraldton produces end-products from zircon and rutile. The Capel processing plant in the southwest of Western Australia produces high-grade, synthetic rutile from ilmenite ore by means of chemical conversion in a rotary kiln.
In 2021, Tronox, headquartered in Stamford, CT, in the USA, generated a turnover of 3.6 bill. US$. Following the takeover of Cristal in 2019, it has TiO2 pigment production totalling 1.1 mill. t. In 2021, Tronox achieved market shares of 27 % for synthetic rutile, 28 % for rutile and 19 % for zirconium. Surface mining in the Snapper Mine in Murray Basin in New South Wales/Australia has been underway since 2010, with a second excavator going into operation in 2011 (Fig. 12). The ore is first concentrated on site and then transported to Broken Hill for further processing. For zirconium, Tronox has ore reserves from various mines, including 4.6 mill. t in Namakwa in South Africa, 1.0 mill. t in KZN Sands in South Africa as well as 1.1 mill. t and 0.7 mill. t in the mines in northern and eastern Australia.
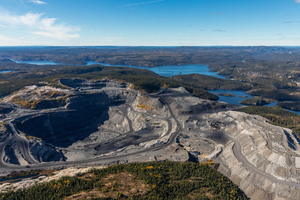
Another heavyweight in the mining of mineral sands for TiO2 production is Rio Tinto, the British-Australian mining conglomerate. In 2022, the company produced a total of 1.2 mill. t TiO2 slag compared to 1.014 mill. t in 2021. The materials are mined in Canada, South Africa and Madagascar. Rio Tinto Iron and Titanium (RTIT) in Quebec/Canada has been processing ores from the region for more than 70 years. The Lac Tio Mine (Fig. 13) lies 43 km northeast of Havre-Saint-Pierre on the largest solid ilmenite deposit in the world. Richards Bay Minerals (RBM) is South Africa’s largest producer of mineral sand and is mining the mineral-rich sands from the northern province of KwaZulu-Natal for the production of zirconium, rutile, iron and slag: In the region of Southeast Madagascar, QIT Madagascar Minerals is also mining ilmenite ores.
4 Niobium and tantalum
Niobium and tantalum are much in demand as metals and have been used so far mainly as alloying components in stainless steel for the automotive and aerospace industry. Niobium in particular is very popular and is around 8 to 10 times more expensive than copper. Because of their similarity, the two elements usually occur together in nature and that mainly in the mineral columbite, which is also called coltan and stands on the list of “conflict minerals”. The worldwide annual production quantities of tantalum are below 5 kt. A relatively large part of the tantalum supply comes from slags produced during the smelting of tin ores. The quantities of niobium, on the other hand, are much higher and reached around 120 kt in 2021. Worldwide, however, there are only three niobium producers.
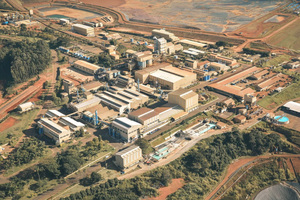
The leading company is CBMM (Companhia Brasileira de Metalurgia e Mineração) from Brazil. CBMM extracts the metal from a pyrochlore ore in Minas Gerais in the southeast of Brazil. The processing plant (Fig. 14) has a capacity of 150 kt niobium. Besides the mine, the CBMM industry complex in the town of Araxá comprises a concentration unit, a refinery and metallurgy unit, a production plant for niobium oxide, special oxides, special alloys and a plant for metallic niobium. In 2021, as a starting material for niobium, CBMM produced a total of 91.92 kt ferroniobium and 7.79 kt speciality products, compared with 109.4 kt ferroniobium and 13.5 kt speciality products in 2019. The company sees itself as well placed for the future and, together with Echion Technologies, it is planning a plant for the production of Nb battery metals with an initial capacity of 2000 t/a.
The other two producers of niobium are CMOC (formerly China Molybdenum) with one mine in Brazil and Niobec with one mine in Canada. In 2016, CMOC bought the Boa Vista Mine with the Morro do Padre niobium deposit from Anglo-American. The material is concentrated at a complex near the town of Catalão in the Brazilian state of Goiás. A quantity of 8.568 kt ferroniobium was produced in 2021. The ore reserves of the Boa Vista Mine are estimated as 17 mill. t with an average content of 0.94 % Nb2O5. Niobec, headquartered in Saint-Honoré in the Quebec region in Canada, has been producing niobium since 1976. At the last count, around 5 kt were produced there. Niobec is a subsidiary of Magris Performance Materials, which supplies 50 % of the North American talcum market. Just 1 km away from the Niobec Mine there is a second mine for the planned extraction of REE.
5 Battery raw materials
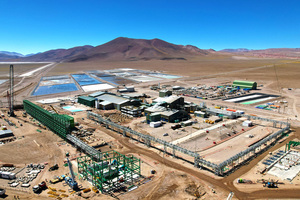
The global demand for lithium is set to triple from around 0.5 Mta in 2021 to 1.5 Mta in 2025 and to increase even sixfold to 3.0 Mta by 2030 [5]. Up to now, the global lithium market has only been made up of a few producers. These include Albemarle Corp. and Livent Corp. from the USA, Mineral Resources from Australia, Sociedad Química y Minera de Chile S.A. (SQM) along with the Chinese companies Tianqi Lithium and Ganfeng Lithium. In the 2022 financial year, Albemarle generated a turnover of 7.32 bill. US$ compared with 3.33 bill. US$ in 2021. That corresponds to growth of 120 %. Albemarle mines lithium mainly in Chile and Australia. It has a stake of 49 % in Talison Lithium (Fig. 15) in Western Australia, while 51 % is held by the Chinese-based Tianqi Lithium. The processing capacities in Western Australia are being expanded in Kemerton, where around 50 kt LCE (Lithium Carbonate Equivalent) lithium hydroxide are to be produced. Mineral Resources, which is involved in several projects, is one of the fastest-growing companies in the sector.
Attracted by the favourable growth forecast, not only the above-mentioned companies, but numerous new players have become interested in the lithium market. These include automobile manufacturers like TESLA, battery manufacturers like CATL, recycling companies like Redwood Materials [6] and large, well-capitalized companies like Rio Tinto. So between the existing players like Livent Corp with an expansion project in Argentina (Fig. 15) and a large number of new players, there will be a race to increase production capacities. In Europe alone, there are more than ten mine projects (Table 1) with an annual production capacity of 250 kt LCE. The list of companies pressing ahead with these projects includes names like Rio Tinto, Imerys and Sibanye-Stillwater. However, only limited information is currently available on when these projects are going into operation.
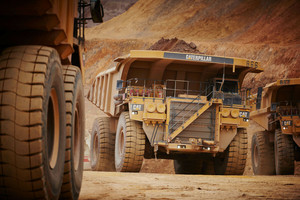
According to the recent market report by the Cobalt Institute from May 2022, in 2021 the global mine production grew by 12 % to 160 kt, thus recovering from the losses in 2020 [7]. With 74 %, the Democratic Republic of Congo (DRC) again accounted for the main part of production and was also responsible for 87 % (15 kt) of the year’s increase. Small-scale mining (mainly in the DRC), which has recently come in for some criticism, produced 14.5 kt, that corresponds to 12 % of the total production in the DRC. The largest producers worldwide are Glencore, China Molybdenum, Gecamines from the DRC as well as Zhejiang Huayou Cobalt. Glencore produces its largest quantities of cobalt in the copper mines Katanga (Fig. 17), Mutanda and Mopani. With the restart of operations at the Mutanda mine, the production quantities increased. Around 83.5 % of the global cobalt production goes into lithium ion batteries, 6.1 % goes into metal production, 5.1 % into superalloys and the rest predominantly into chemicals production.
6 Outlook
If you follow the discussion about critical raw materials over a longer time, you can see especially in the EU, that despite the constant updating of the data, the main focus is always on the producing countries. While this may be expedient in view of the current geopolitical developments, unfortunately, not enough attention is given to the international players in the critical resources market. This does not refer to the countries, but to the mining companies involved. To assure the future supply of critical resources, the crucial aspect is therefore not where these resources come from, but which companies are mining these raw materials and how to do business or make joint investments with these companies. Unfortunately, some of the other countries in the EU are well ahead here.
Literature
[1] Basuyau, V.: EU raw materials policy for a resilient, net-zero Europe. Presentation at the 2nd Global GypSupply Conference & Exhibition. 22 February 2023, Brussels/Belgium
[2] Harder, J.: Critical resources – China, changes in the resources policy? In: AT MINERAL PROCESSING 7-8/2022, pp. 52-64
[3] Harder, J.: Technical Metals – New focus on rare earth elements. In: AT MINERAL PROCESSING 10/2018, pp. 76-88
[4] Harder, J.: Mineral sand trends – Market overview of the heavy minerals industry. In: AT MINERAL PROCESSING 12/2010, pp. 42-55
[5] Hanicke, M. et. all.: Lithium-ion battery demand 2030. McKinsey & Company, Automotive and Assembly, January 2023, Gothenburg/Sweden
[6] Harder, J.: Turning point – New era for the recycling industry? In: recovery – Recycling Technology Worldwide 2/2023, pp. 48-60
[7] Fischer, H.: Cobalt Market Report 2021, Cobalt Institute, Mai 2022. London/UK