Current and future challenges in fertilizer production

 © Yara
 © Nutrien
 © IFA
© IFA
 © IFA
© IFA
 © IFA
© IFA
 © IFA
© IFA
 © IFA
© IFA
 © IFA
© IFA
 © IFA, OneStone Research
 © IFA, OneStone Research
 © IFA
© IFA
 © Nutrien
 © Nutrien
 © Nutrien
 © Mosaic
 © Uralkali
 © Yara
 © EuroChem
 © FAO
© FAO
 © Nutrien
The consumption of fertilizers is booming. On ever smaller areas of cultivated land, more and more crops must be harvested to feed the world’s growing population. Last year, global consumption increased by around 2.0 %, despite the Corona pandemic. In the following market report, the current market trends are shown and an insight into this industry is presented.
1 Introduction
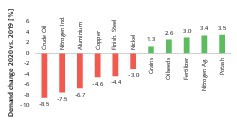
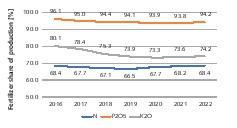
By the mid-21st century, around 9.7 bill. people will need to be fed. While the global population is growing rapidly, the land available for growing crops is decreasing in many countries. Accordingly, increasing yields are needed from every area of cultivated land. This can be achieved with modern mineral fertilizers, which can be selectively spread onto the land to provide the crops with the minerals they need to grow [1; 2]. This is clear, even in Corona pandemic times. While important industrial raw materials experienced losses in 2020, the consumption of cereals, oil seeds, and especially mineral fertilizers such as nitrogen fertilizer and potash fertilizer increased (Fig. 1).
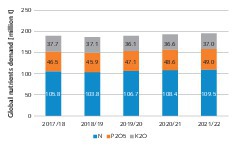
Fig. 2 shows how, according to the International Fertilizer Association (IFA), the three mineral fertilizers, nitrogen (N), phosphate (P2O5) and potash (K2O) have developed in recent years and what influence the Corona pandemic is having on their development [3]. According to these figures, the global demand is growing by 2.0 % in 2020/21, phosphate showing the biggest growth with 3.2 %. Nitrogen fertilizer and potash fertilizer are growing more moderately by 1.6 % and 1.4 %, respectively. The biggest market growth is registered in Southern Asia (India), followed by Latin America (Brazil), Africa and North America. Northeast Asia (without China) and the Middle East report limited growth.
2 Fertilizer consumption in the regions and countries of the world
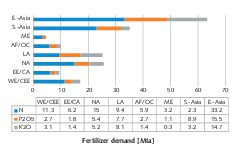
Fig. 3 shows how the consumption of mineral fertilizer is distributed across the regions of the world. 2019 was taken as the base year for the consumption figures. It can be seen that the region of Eastern Asia (incl. China) accounts for a large part of consumption, around 1/3. The Middle East accounts for only around 2.5 % of consumption, while Africa and Oceania make up around 5.3 %. Besides Eastern Asia, the largest quantities of mineral fertilizer are used in Southern Asia, followed by North and Latin America. Western and Central Europe (WE/CEE) account for just 9 %, East Europe and Central Asia (EE/CA) reach just under 5.0 %. Small differences in these distributions result for the different mineral fertilizers.
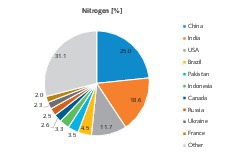
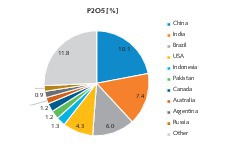
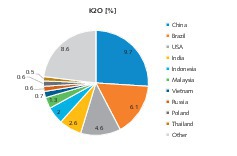
In Fig. 4 to Fig. 6, the respective TOP 10 countries for consumption of the individual mineral fertilizers are shown for the year 2019. Fig. 4 lists the most important consumer countries for nitrogen fertilizer. As expected, the list is headed by China, which accounts for 25 mill. tonnes per annum (Mta) or 23.3 % of the global demand. India and the USA follow in 2nd and 3rd place with 17.4 % and 10.9 % respectively. The other TOP 10 countries have percentages from 2 to 4 %. The TOP 10 total 71 % of demand. In the case of phosphate fertilizer (Fig. 5) and potash fertilizer (Fig. 6), the percentages do not differ significantly. The TOP 3 there are China, India and Brazil or China, Brazil and the USA, respectively.
3 Global production capacities for fertilizers
Fig. 7 shows how the production capacities for the individual fertilizers have developed in recent years with an outlook for the year 2022. It should be noted that the entire capacities are recorded here, that is both that for the fertilizer production as well as that for industrial production. The capacity for ammonia (N) is increasing from 180.5 Mta to 190.4 Mta by 2022, that for phosphoric acid (P2O5) is increasing from 57.2 Mta to 63.7 Mta and that for potash (K2O) from 54.6 Mta to 64.6 Mta. It can be seen that the capacities for ammonia are increasing only insignificantly from 2019 to 2022, while the capacities for the other two substances are increasing moderately by a few percent.
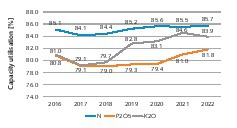
The capacity utilizations associated with the capacities are found in Fig. 8. The production of ammonia reaches the highest capacity utilization of 85 to 86 %. The lowest capacity utilizations are obtained for the production of phosphoric acid, however, here as in the production of potash, significant increases have been observed, although at the same time the capacities have increased somewhat. From the share of fertilizer production in the total production, however, few conclusions can be drawn (Fig. 9). In the production of phosphoric acid, the share of the fertilizer production is highest and has changed little in recent years. The largest percentage increases since 2019 are still obtained in ammonia production.
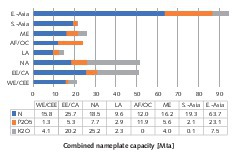
The capacities for fertilizer and industrial production for the different regions in 2019 are shown in Fig. 10. The total capacity here is 304 Mta. The region of Eastern Asia with 94.3 Mta accounts for exactly 31 % of the global capacity, for the production of ammonia alone, 63.7 Mta capacity are available. North America and East Europe/Central Asia reach capacities over 50 Mta. Here the percentages for potash are especially notable. All other global regions have relatively small production capacities in comparison, Western Europe/Central Europe being undercut only by Latin America. Striking is that in the Middle East, capacities are much higher than consumption.
4 Major fertilizer producers
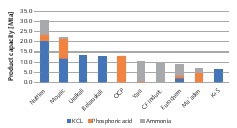
Fig. 11 shows the ten largest fertilizer producers with their nominal capacities as of 31 December 2019. Company shares are included based on their proportional share. For potash fertilizer, KCl was chosen as a benchmark rather than K2O. The phosphoric acid capacities are designed for commercially available products with a content of 56 % P2O5. Chinese companies are not included in the TOP 10. In total, the TOP 10 reach fertilizer capacities totalling 134 Mta, which corresponds to just under 44 % of the global capacities. The capacity of the TOP 10 for KCl amounts to 67 Mta, corresponding to 100 % of the K2O capacity. For phosphoric acid, the TOP 10 reach 32.2 Mta or 54 % of the global capacities, for ammonia the TOP 10 reach 34.8 Mta, that is only a good 19 % of the worldwide capacities.
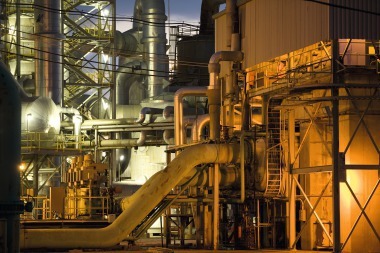
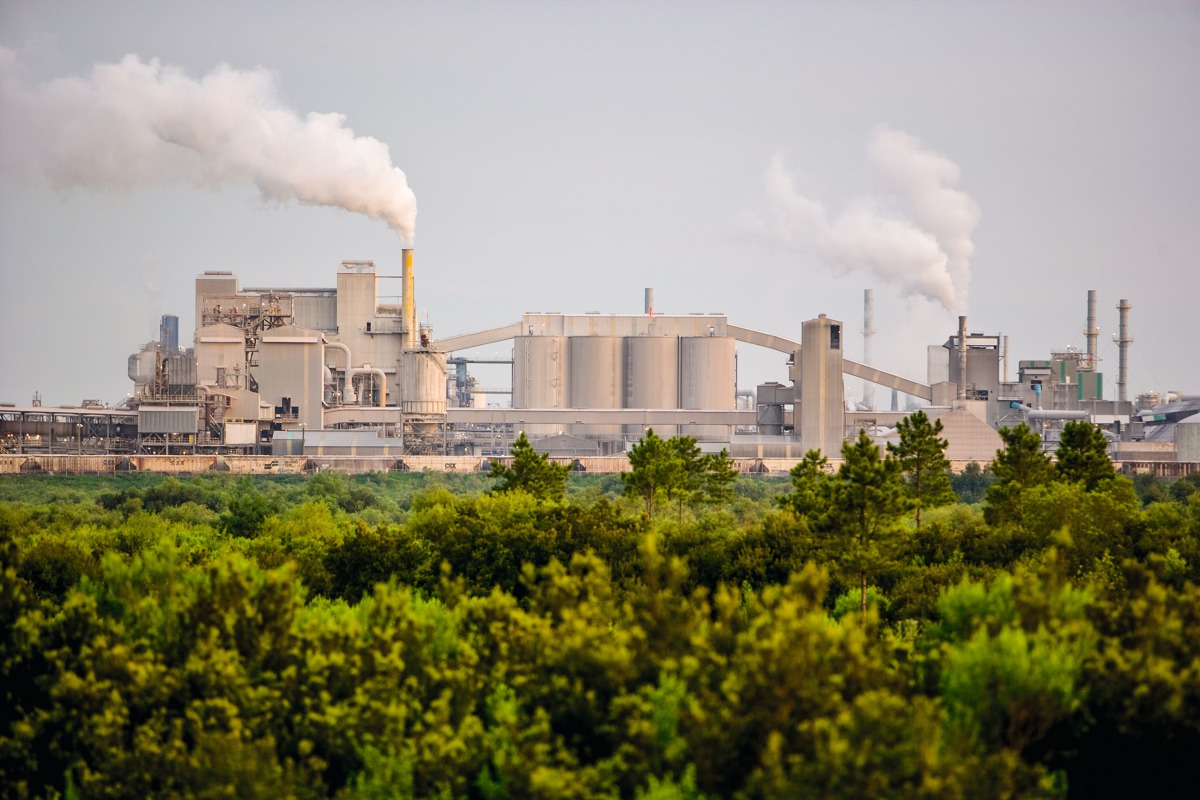
Nutrien, the Number 1 in fertilizers was formed in 2018 from the merger of Agrium and PotashCorp. The company generated sales totalling 20.908 bill. US$ in 2020, after 20.084 bill. US$ in 2019, that corresponds to an increase of 4 %. All six of the company’s production sites for potash with 20.6 Mta are found in the Canadian province of Saskatchewan. Patience Lake (Fig. 12) is the smallest site, with a capacity of 0.3 Mta, but the only plant working to 100 % capacity. The average capacity utilization is just 60.7 %. With brownfield extensions, the capacity can still be increased to 23 Mta. Nitrogen fertilizer is produced in plants in Canada, the USA (Fig. 13) as well as in Egypt, Argentina and Trinidad & Tobago. Phosphate is produced in plants in the USA.
The Mosaic Company (Mosaic), the No. 2 in the sector produced 9.4 Mta potash in 2020 compared to 7.8 Mta in 2019 and, in addition, 8.5 Mta phosphates (Fig. 14) compared to 8.2 Mta in 2019. The company profited from the pick-up in demand in the second half of 2020. Mosaic is a strong market force in Brazil with 70 % of the phosphate production and 100 % of the potash production there. The two products make up around 70 % of the fertilizer demand in Brazil. The sales volumes in Brazil grew by 14 % to 10.6 Mta mineral fertilizer, however, earnings were reduced on account of the lower prices. Overall, in 2020, sales totalling 8.6 bill. US$ were achieved following 8.9 bill. US$ in 2019. Gross profit grew from 0.897 bill. US$ to 1.065 bill. US$.
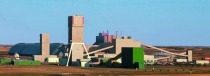
Uralkali and Belaruskali, the two companies next in the ranking, are, besides Nutrien and Mosaic, the leading potash producers. Uralkali currently has a nominal capacity of 13.2 Mta potash. In 2019, a production level of 11.1 Mta was achieved. The portfolio comprises 5 mines (Fig. 15) and 7 ore processing plants in the towns of Berezniki and Solikamsk (Perm region of Russia). Belaruskali is the counterpart to Uralkali in Belarus. The company has a nominal capacity totalling 13.0 Mta from 4 mines, which are located in the Starobin potash salt deposits, around 150 km south of the capital Minsk. At the beginning of the year, Belaruskali concluded a long-term supply contract with Indian Potash Limited (IPL), which has been rated by market experts as underpriced.
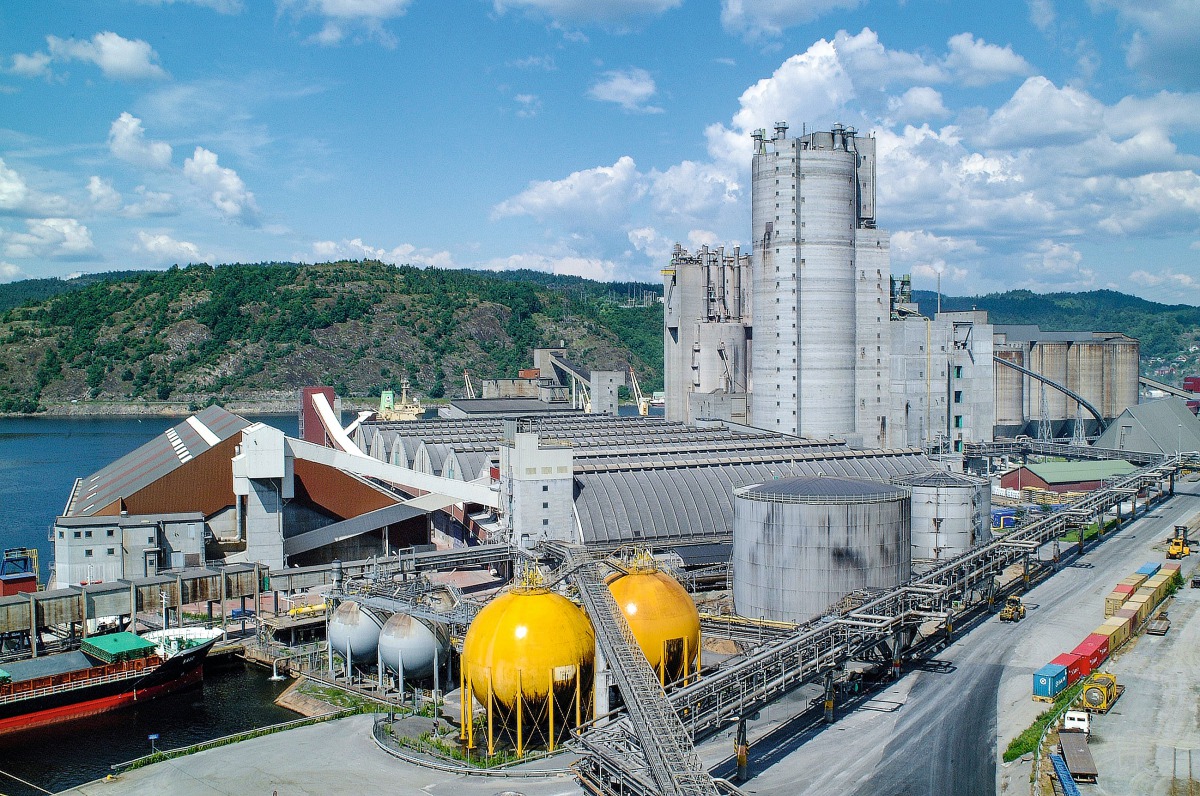
OCP, Yara und CF Industries are the next companies in the ranking. OCP from Morocco is the world’s leading company in the production of raw phosphate. In 2019, sales of 5.622 bill. US$ were generated. 8.9 Mta fertilizer and 2.0 Mta phosphoric acid were exported. In the first three quarters of 2020, the fertilizer exports increased by 26.5 % compared with 2019. Yara achieved sales of 12.9 bill. US$ in 2019. Overall 22.1 Mta products were sold, including 5.677 Mta NPK fertilizer. Porsgrunn (Fig. 16) is Yara’s biggest industrial base in Norway and has Europe’s biggest installed production capacity for NPK complex fertilizer. CF Industries is regarded as a leading producer of hydrogen and nitrogen.
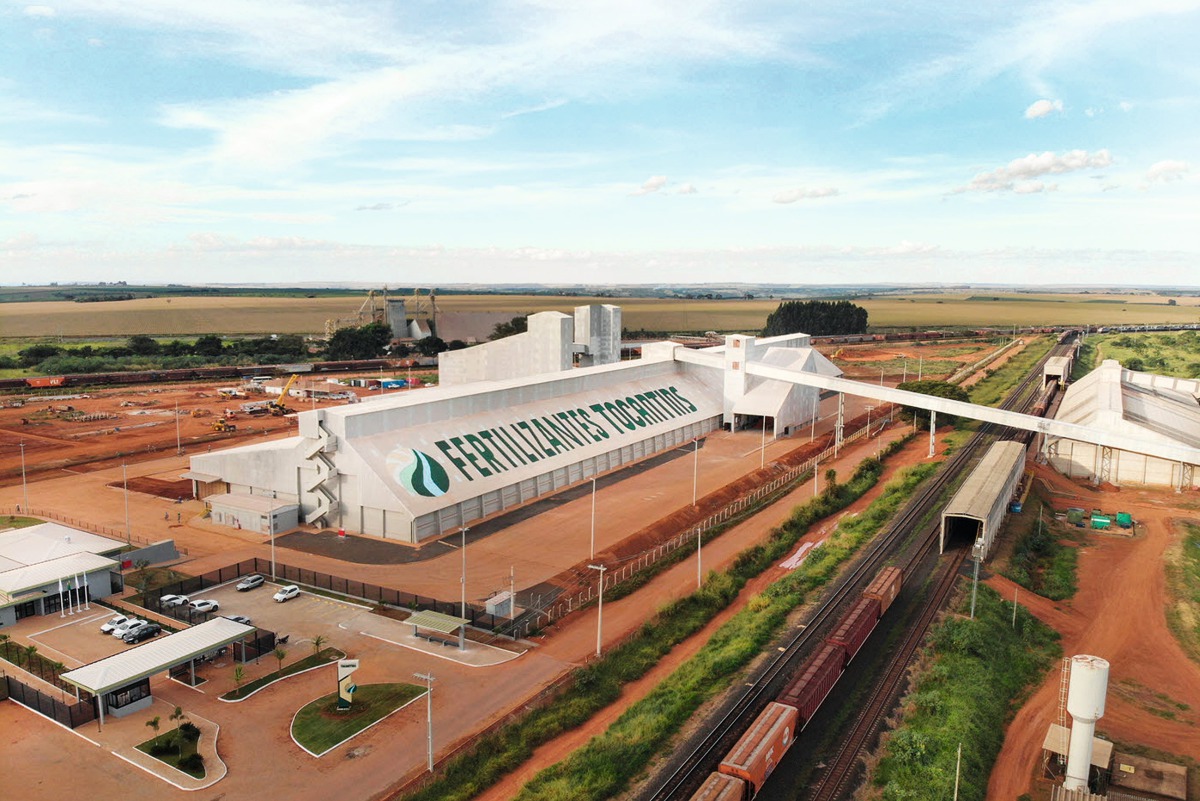
The TOP 10 list is rounded off by Eurochem, Ma’aden and Kali+Salz. Eurochem is one of the few producers that offers the entire N / P / K fertilizer range. With 6.17 bill. US$ in 2020, the company matched its sales in 2019. EuroChem’s most important production sites are located in Russia. But the company is active in other countries, too. At Minas Gerais, the third production site (Fig. 17) started operation in Brazil in mid-2019. Ma’adens ammonia and phosphate plants went into operation in Saudi Arabia in 2011/2012. Since then the company has become established as an important supplier. The Kali+Salz Group generated annual sales of 4.07 bill. € in 2019, the operative unit in America accounting for 1.53 bill. €. This unit has now been sold to Stone Canyon Industries for a price of 3.2 bill. US$.
5 Trends and challenges
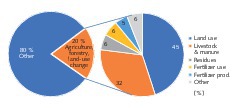
One of the biggest challenges for the fertilizer industry is how it deals the issue of climate warming. According to the latest data from FAOSTAT of the United Nations from 2020, the agricultural and forestry sector share of the global greenhouse emissions is 20 % (Fig. 18). Up to now, up to 30 % was assumed. According to this, the biggest share of the greenhouse gas emissions from the agricultural sector come from land consumption with 45 %, followed by cattle farming with 32 %. The production of fertilizers reaches 5 % and this makes up a share of 1.0 % of the global emissions of 53.6 bill. T CO2-equivalents. The use of fertilizer makes up another percentage of 6 % or 1.2 % of the global emissions.
In the discussion, there are of course other aspects. According to the estimates of the UNCCD Global Land Outlook Report 2017, from 2000 to 2030, between 1.6 and 3.3 mill. ha of valuable arable land are lost annually because of urban sprawl. This loss can only be offset by further forest clearing. Particularly impacted by deforestation are according to WWF the valuable tropical rain forests, which are home to 50 % of all animal and plant species. Forests store half of the terrestrial carbon. According to this, 15 % of the global greenhouse emissions can be attributed to deforestation. Between 1990 and 2015, natural forests were destroyed over an area that is roughly 6.5 times the size of Germany.
The leading fertilizer producers are trying to combat this trend towards increasing greenhouse gas emission. Yara has lowered its CO2 emissions since 2005 from 32 t CO2/t N to 18 t CO2/t N in 2019. This was made possible with the use of novel catalytic converters and energy savings in the production of nitrogen. Up to 2030, further savings of 6 t CO2/t N are planned at Yara. The company is aiming for climate-neutral production by 2050. Mosaic also signed up to the UN “Sustainable Development Goals” in 2018. From 2015 to this day, greenhouse gas emissions have been reduced by 13 %. By 2035, reductions on the same scale are set to be made. Another topic are product improvements. With the Yara Premium Product CAN in wheat farming, for example, 10 % less nitrogen could be achieved compared to conventional urea fertilizers.
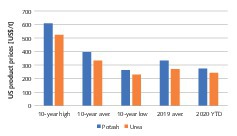
The challenges for the fertilizer industry are also of an economic nature. Especially the wide price fluctuations in the producer prices for mineral fertilizer are causing problems for the companies. In 2020 the producer prices ranged mostly in the lower level, as shown in Fig. 19 with the example of prices for potash and urea. The prices obtained in the US Midwest for potash in 2020 at around 275 US$/t differ only insignificantly from the 10 year low prices. The same applies to the NOLA-FOB-prices for urea. In 2020, with around 243 US$/t for urea, the 10-year low prices were almost reached. Fertilizer prices are mostly a reflection of the producer prices for key products such as grain, wheat, soya, cotton and oilseeds.
With energy savings, improved automation and higher capacity utilization, the fertilizer producers are trying to combat the price developments. The leading companies have been successful in this for some years. Corresponding results can be taken from the profitability reports and so-called cash costs. There are, however, a number of developments on which the producers have only little or no influence. One example are the rising energy costs that are causing problems especially for nitrogen producers because large quantities of energy are needed for nitrogen production.
6 Outlook
In general, the prospects for the production of fertilizer are favourable. Reasons are the supply of the growing global population of around 80 mill. annually with foodstuffs and the increasing demand for mineral fertilizer for cultivating land. The fertilizer industry has the task of specifically developing improved fertilizers that need less energy and fewer resources. Fertilizer users must spread fertilizer more selectively, so as to avoid overfertilization. This calls on all links in the application chain and researchers.
Literatur • Literature
[1] Harder, J.: Pink gold – Market outlook and technologies for the potash industry. AT MINERAL PROCESSING, 9/2009, pp. 36 – 51
[2] Harder, J.: Capacities and consumption – Trends in the phosphate industry. AT MINERAL PROCESSING, 5/2018, pp. 62 – 73
[3] IFA: Public Summary Short-Term Fertilizer Outlook 2020 – 2021, Market Intelligence and Agriculture Services, International Fertilizer Association (IFA), IFA Virtual Strategic Forum, 17 – 19 November 2020, Paris/France
Author:
Dr.-Ing. Joachim Harder, OneStone Consulting Ltd., Varna/Bulgaria
www.onestone.consulting
Joachim Harder (1952) studied process engineering at Braunschweig University of Technology and earned his Ph.D. there. After more than 10 years working in industry in various management posts, in 1997 he established the consulting company OneStone Consulting. Dr. Harder is an acknowledged expert in international marketing, specializing in market analysis for business segment strategies. He is the author of diverse publications and a popular conference speaker.