Advantages and areas of application, comparative screening tests
 © Helfried Gschaider
 © Binder+Co AG
 © Binder+Co AG
 © Helfried Gschaider
 © Helfried Gschaider
 © Helfried Gschaider
 © Binder+Co AG
 © Helfried Gschaider
 © Helfried Gschaider
 © Helfried Gschaider
 © Helfried Gschaider
 © Helfried Gschaider
 © Helfried Gschaider
 © Helfried Gschaider
 © Binder+Co AG
 © Binder+Co AG
 © Binder+Co AG
 © Binder+Co AG
 © Binder+Co AG
 © Binder+Co AG
 © Binder+Co AG
 © Binder+Co AG
The BIVITEC e+ combines two technologies developed by Binder+Co in one screening machine: the low dynamic loads due to mass balancing of the resonance screening machine and the flip flow system of the BIVITEC. This results in a lightweight design and low drive power. In the following report, the considerations for the development of a new type series are outlined, advantages and fields of application of the newly developed screening machines are explained, comparative screening tests are described, test results are presented, and several case studies are illustrated.
1 Introduction
In the 1980s, Binder+Co developed the type series of the BIVITEC flip flow screen for the classification of materials difficult to screen. These internationally known machines, which are used worldwide, have vibrating screen boxes which are braced by support springs on concrete or steel platforms and vibrated by means of unbalance exciters. Static and dynamic loads occur in the process, which place high demands on the support structure, especially in the case of larger machines, and result in corresponding costs. For more than 65 years, Binder+Co has also been manufacturing horizontally mounted resonance screening machines, which introduce relatively low dynamic loads into the environment by means of countervailing vibration of two screen decks of approximately equal mass. These machines are among the conventional screening machines with rigid screen decks and are supported on platforms via shear rubber blocks. The basic idea was to combine these two proven systems in a new type series of flip flow screening machines (BIVITEC e+) [1]. The overriding objective was to generate a high benefit for the operators of such screening machines from the resulting product characteristics, both in terms of investment costs and operating costs.
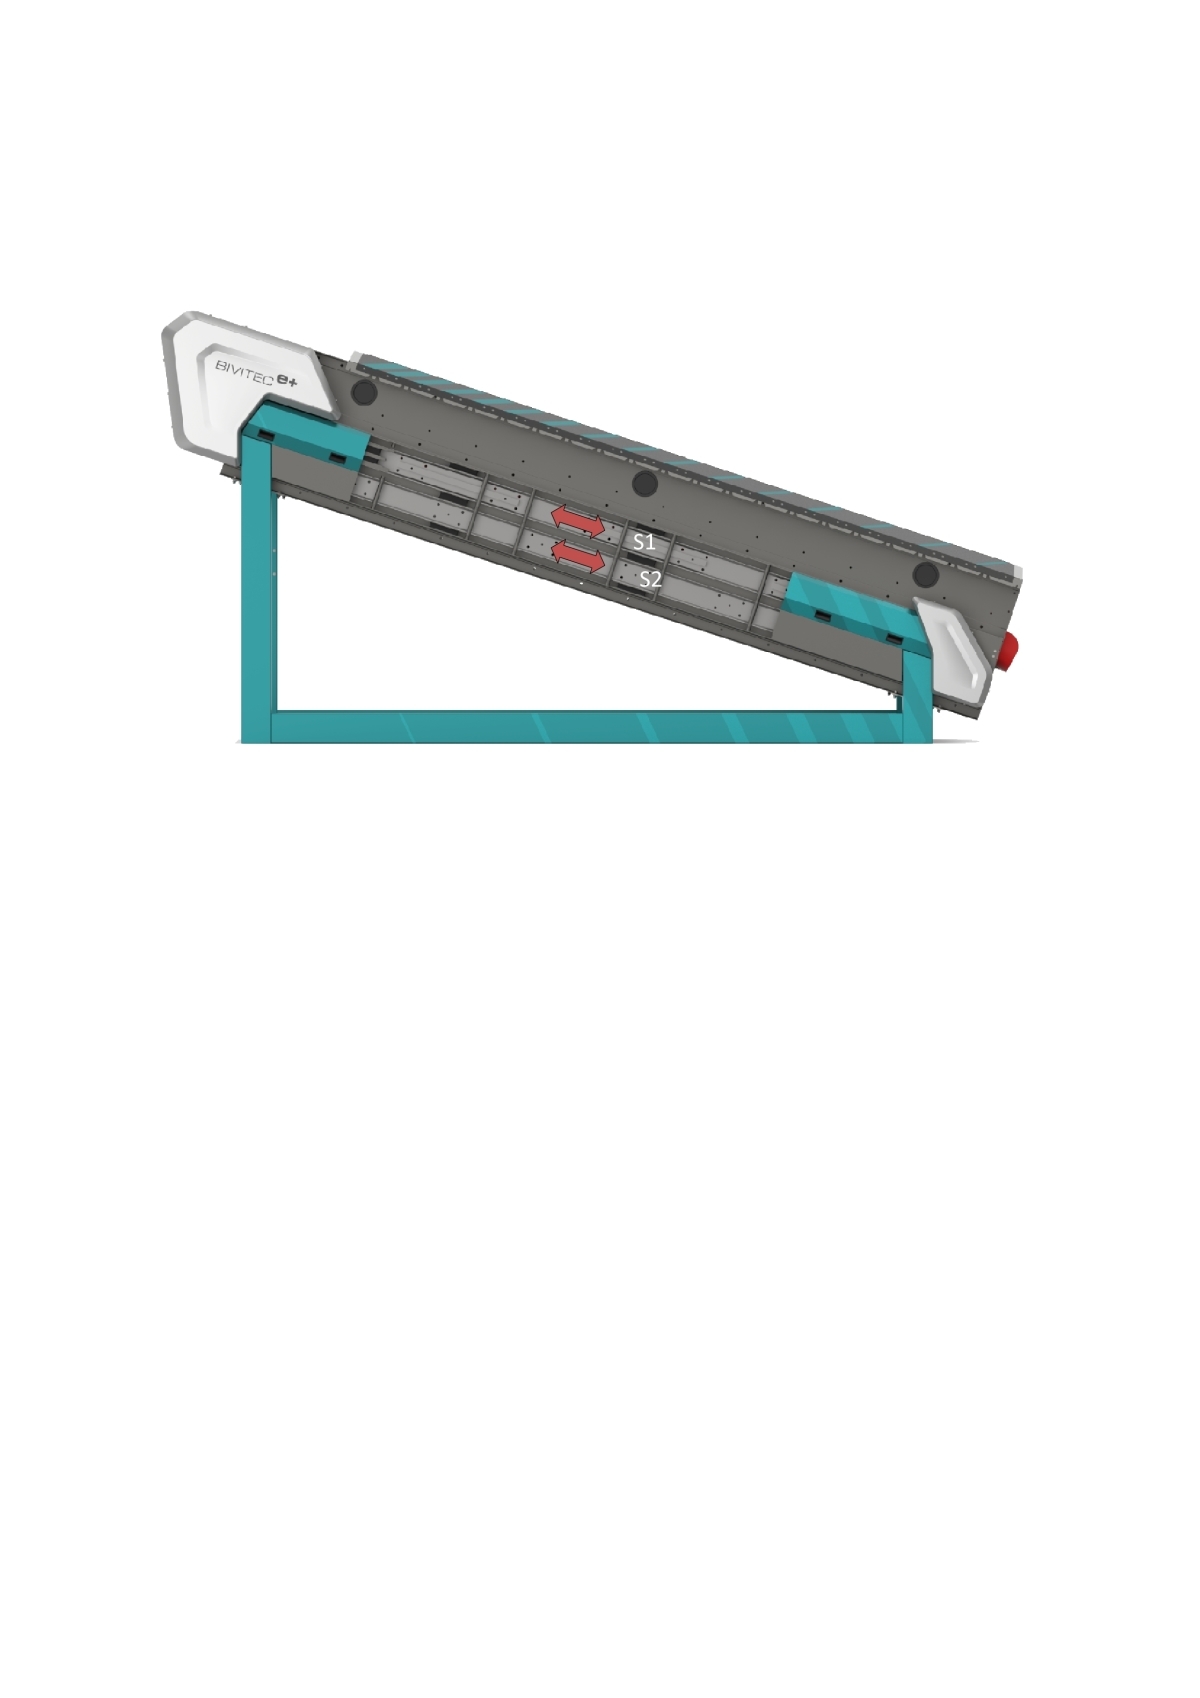
The first machines of this new type series were developed in 2019 and have a stationary screen box. Support via spring elements on the support structure is not required but can bring advantages in individual cases for further reduction of dynamic loads. Due to an almost perfect mass balancing of two oscillating masses S1 and S2 moving in opposite directions, only very low residual dynamic forces occur (Fig. 1). The oscillating masses are driven by an eccentric exciter and operated in the resonance range. Screen mats fixed between the respective cross-members are alternately stretched and compressed, resulting in a whip effect which, combined with a screen deck inclination of approx. 15° to 25°, ensures material conveying and correspondingly sharp screening. Due to the low moving oscillating masses combined with the resonance principle, the new type series BIVITEC e+ in the single-deck version requires only approx. one third of the electrical energy for the drive motor compared to conventional BIVITEC screening machines. For large machine types, a weight reduction of up to 40 % can be achieved compared to a classic BIVITEC. The machine characteristic or operating frequency is almost infinitely adjustable or controllable by means of a frequency converter mounted on the motor and can be quickly and easily adapted to the particular material to be screened.
2 Advantages and application fields for BIVITEC e+
Depending on the task or project situation, the following advantages and areas of application are of particular importance:
Low dynamic loads
Low energy consumption
Infinitely variable adjustability and controllability of the vibration characteristics
Compact design
Dust-retardant design easy to implement
Screen deck areas from 1.2 m² to 49 m²
Finest to medium separation cuts
For stationary and mobile plants
An outstanding feature of the new type series concerns the very low required drive powers of the screening machines. To illustrate the resulting energy savings or the extremely low drive power ratings, the single-deck machines of the “KRL” type series (“classic” BIVITEC screening machines with “circular” basic vibration) will be compared with the machines of the new “EXL” type series (BIVITEC e+) in the following. The screening machine standard “KRL” comprises 45 single deck machines with screen deck widths from 0.8 m to 3.5 m and screen deck lengths from 3 m to 12 m. The screen deck widths indicate the respective internal dimensions available for the screening process (perforated screen mat area). The screen deck lengths indicate the distances from the first perforated to the last perforated screen mat of the screen decks considered. With the BIVITEC e+ (type designation “EXL”), even larger screen deck areas are possible due to the maximum standard screen deck length of 14 m. The “EXL standard matrix” contains 93 single deck machines with screen deck widths from 1 m to 3.5 m and screen deck lengths from 4.7 m to 14 m. The largest screen deck area per deck is thus 49 m² (3.5 m x 14 m), allowing a total screen deck area of 147 m² for a three-deck machine.
In Fig. 2, the nominal drive powers (kW) are assigned to the respective screen deck areas (m²). The total of 45 points – shown as “red filled” circles – identify the single deck machines of the “classic” KRL machines. In comparison, the machines from the new type series (BIVITEC e+ or EXL) were identified by 93 “blue-filled” squares. Looking at these two “point clouds”, the considerably lower drive ratings of the screening machines of the new type series can be clearly seen. An associated trend line is shown for each of the two-point clouds or data series. The trend line shown as a “solid” straight line refers to the “classic” BIVITEC machines, the dashed straight line to the new BIVITEC e+ type series.
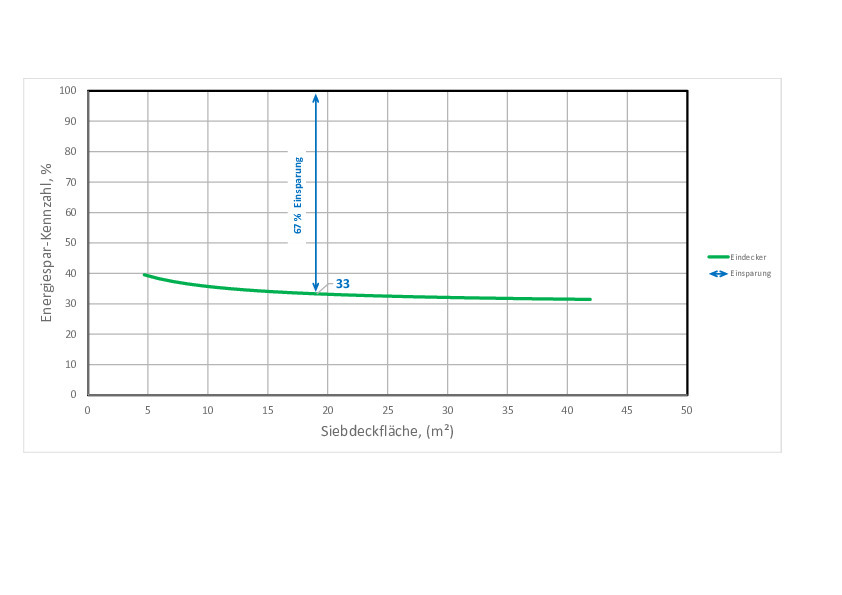
If these linear functions are put into relation, namely comparatively “EXL”/”KRL”, the result is Fig. 3. This figure is intended to quantify the energy saving potential of the new type series. The comparable screen deck areas are in the range between 4.7 m² and 42 m². The functional values calculated in this way are referred to here as energy-saving ratios and given as percentages. Thus, the comparison of the single-deck machines yields an average energy-saving ratio of 33 %. This means that the installed nominal drive power of a screening machine of the new type series is on average only approx. 33 % compared to the installed nominal drive power of a machine of the classic type series with the same screening deck area. In other words, the use of the BIVITEC e+ can save about two thirds of the installed drive power of the single deck machines. From the function curve in Fig. 3 it can be seen that this type of savings potential tends to increase with larger screen deck areas.
3 Comparative sieving tests
3.1 Method of carrying out tests in the pilot plant at Binder+Co
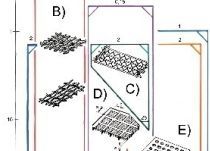
For optimum screening machine design, tests are carried out with a pilot plant screening machine for the corresponding screen cut [2]. In a first step, the feed rate is determined using a calculation program programmed based on a factor method. The experimental machine has an effective usable screen length of maximum 2 m and is adjustable in inclination. A simple screening by feeding the screenings once and sampling the two product streams would in most cases not or only approximately correspond to a large-scale screening. In order to optimally design the required screen deck area for the respective task, the following procedure is followed: The feed quantity of about 1 m³ bulk material required for each test series is introduced into the screen feed hopper of the Binder+Co technical center in Gleisdorf. Considering the previously calculated screening time, the first test section is started and, after a constant operating condition has been reached, representative sampling of both screening products and the feed material is commenced. In each case, the entire stock stream is briefly collected several times with a sampling vessel. The composite samples obtained in this way are tapered by riffle or rotary dividers for the sample analysis provided later. The two product chutes direct the main quantities of screening products into the coarse product container and the fine product container. Similarly, the second test section is then carried out with the coarse product from the first test section. In this case, the screening plant is operated at a reduced feed rate so that the test duration of both sections is as equal as possible. Depending on the large-scale task, a third, fourth or fifth test section follows – if necessary – with as identical a duration as possible.
Fig. 4 shows a test series with three sections. To avoid misunderstandings, it should be noted that the screen shaker symbols shown in Fig. 4 with the numbers 1, 2 and 3 only identify the respective test section, but always refer to one and the same test machine (Fig. 5). After test execution and test evaluation, a correspondingly high specific feed rate results for the first test section, defined as the feed rate (in t/h) divided by the screen deck area provided (in m²). If the first two test sections are combined, G1.2 corresponds to the coarse material of the balance area. The particle size distribution of the fines is calculated from the compositions and product output values of the two fines products F1.1 and F1.2. The fines mass output is calculated as the sum of the two output values. Similarly, all three test sections can be summarized. The screen overflow G1.3 of the third test section is thus considered to be the coarse material of the entire balance area. With regard to the fines of the entire balance area, the three fines F1.1, F1.2 and F1.3 are combined by calculation, with the particle size distribution of this fines resulting from the compositions of the three fines and the mass output values. Compared to the specific feed rate at test section 1, the corresponding value when considering the combined sections 1 and 2 is about half, and about one-third for the combined sections 1, 2 and 3.
3.2 Comparative screen tests “BIVITEC – BIVITEC e+”
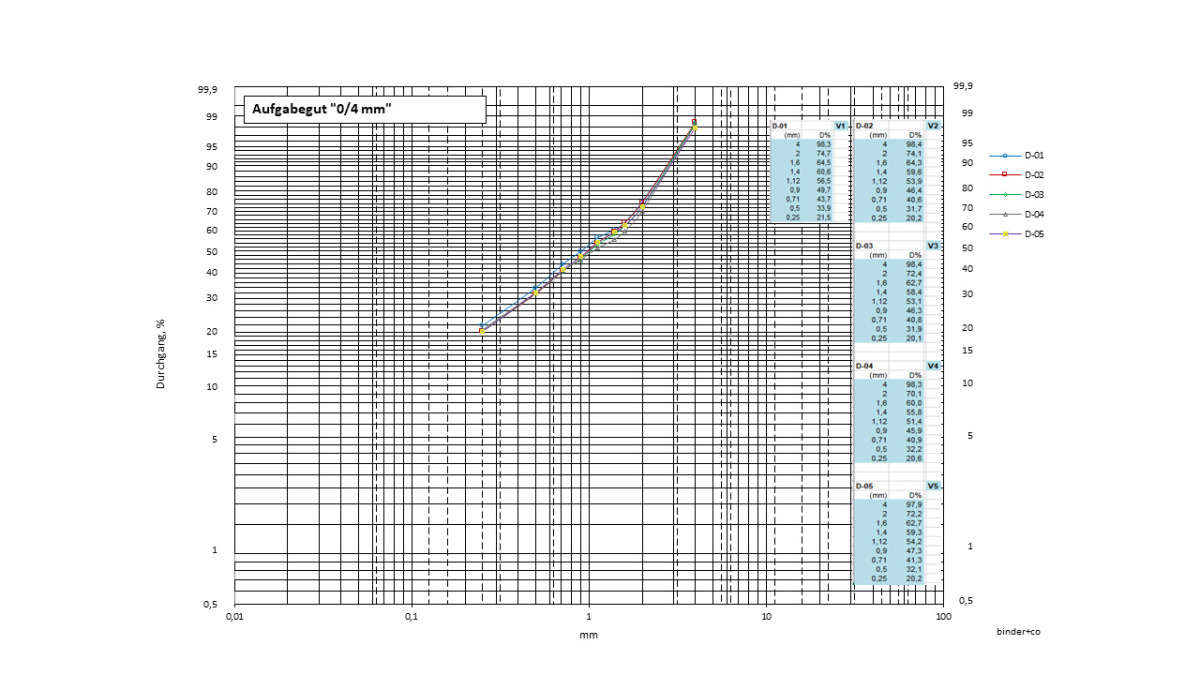
The feed material for the comparative screening tests consisted of 5 big bags with crushed limestone of nominal grain size 0/4 mm. Fig. 6 shows the corresponding particle size distributions in a diagram with logarithmically divided abscissa and double logarithmically divided ordinate. The data series D-01 to D-05 correspond to the test series V1 to V5 with regard to numbering.
The contents of big bag number 1 were accordingly used as feed material for test series V1 and fed to the “classic” test machine. This machine belongs to the LIL series with linear fundamental oscillation and can therefore be operated with a relatively low screen inclination. Test series V1 is to be regarded as the basic test series. For all screen test series planned within this framework, three test sections each with six screen mats used were specified, which in turn corresponds to a total screen deck length of 6 m for each test series. Based on design calculations and preliminary tests, the target feed rate (t/h) for the basic test series was determined for test section1 and a screen deck inclination of 12°. At this point, two very important points should be mentioned: During the comparative screening tests, the objective was not to achieve the highest possible screening efficiencies or particularly low void contents in the products. The objective was rather to carry out a basic series of tests with a relatively high area-specific feed rate (tons per hour and square meter of screen surface area), whereby attention was to be paid to the best possible screen deck inclination with regard to separation efficiency.
Finally, the basic test series was carried out in accordance with the test procedure described in section 3.1. Punched plastic screen mats with perforations of 1 mm x 6 mm were used. For all test sections and test series, a nominal cut point of 0.8 mm is to be taken as the definition. The respective undersize contents in the screen overflow products are thus defined as contents < 0.8 mm and the respective oversize contents in the screen underflow products as contents > 0.8 mm. Concerning the vibration characteristics, precise measurements of vibration amplitudes and vibration frequency were carried out. The specific feed rate for test section 1 of test series 1 was 14.42 t/(m²h). The mass yield of the screen underflow was determined to be 21.2 % for this first test section. The undersize content (< 0.8 mm) in the screen overflow was 33.0 % and the oversize content (> 0.8 mm) in the screen underflow was 3.5 %. The undersize content, which appears very high at first glance, results from the fact that with the first test section, as it were, only the first two running meters of a 6 m long screen deck were simulated and confirms the well selected feed rate. After the second test section, the undersize content of the screen overflow was 17.3 % and after the third section only 5.5 %. From the particle size distributions of the underflow products of sections 1 to 3 and the corresponding product mass yield values, an oversize content of 4.0 % could be calculated for “Section V1.1 + Section V1.2” and an oversize content of 6.0 % for “Section V1.1 + Section V1.2 + Section V1.3”. In summary, for test series 1 – simulation of a screen deck with a length of 6 m – the mass yield of screen underflow is 46.5 %, screen overflow with an undersize content (< 0.8 mm) of 5.5 % and screen underflow with an oversize content (> 0.8 mm) of 6.0 %. These two contents of misplaced material confirm 0.8 mm as a well chosen value for the nominal cut point and confirm test series 1 as a very good basis for the subsequent, comparative test series with the new BIVITEC e+ test machine.
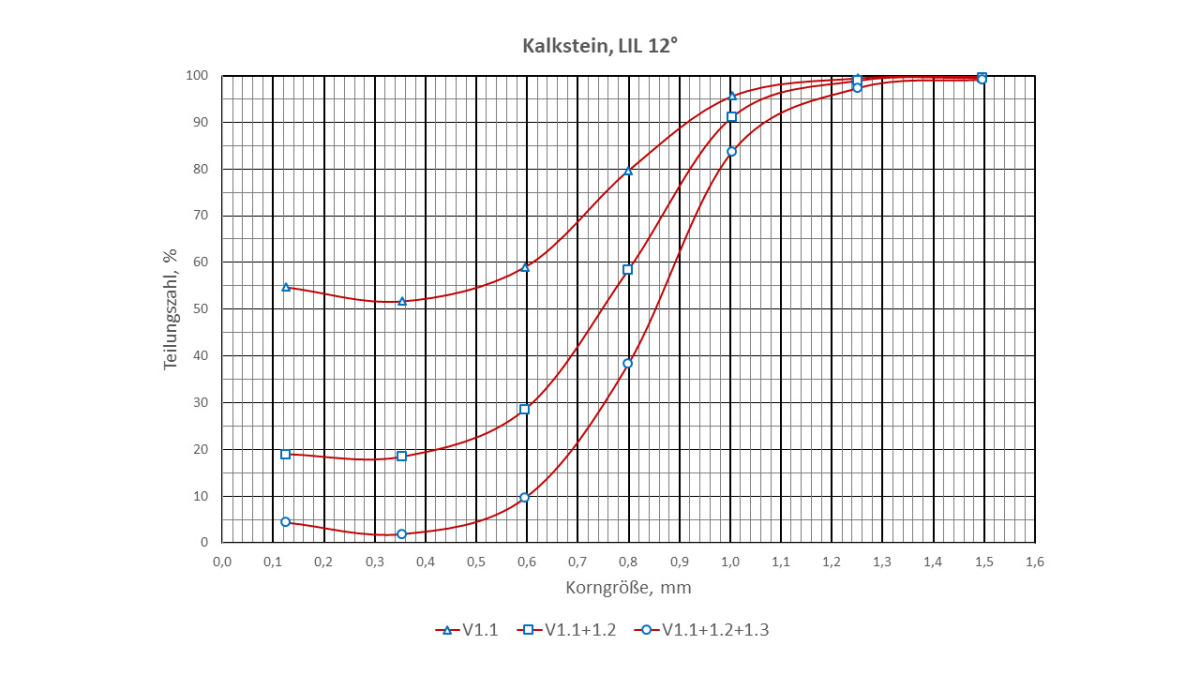
Fig. 7 shows the partition curves of test series 1. The ordinate values correspond to the coarse product-related partition numbers. The grain size is plotted as a characteristic on the abscissa. Seven test screens with mesh sizes from 1.6 mm to 0.25 mm and one test screen tray were used for the particle size analysis. This results in seven feature classes in each case. The coarsest characteristic class for the calculation of the coarse product-related partition number is grain size class 1.4/1.6 mm. This is followed by the grain size class 1.12/1.4 mm ... to 0.25/0.5 mm. For these grain size classes, the geometric mean values (square root of the product of the upper characteristic class limit and the lower characteristic class limit) were determined for the graphical representation of the partition numbers. For the entry of the graduation numbers for the finest grain size class 0/0.25 mm, the arithmetic mean (0.125 mm) is considered agreed.
The upper partition curve describes the separation characteristic of test section V1.1. The ordinate values of the triangular symbols correspond to the coarse product-related partition numbers, the associated abscissa values refer to the respective particle size classes. Similarly, the points for the separation characteristics of “Section V1.1 + Section V1.2” (square symbols) and the points for “Section V1.1 + Section V1.2 + Section V1.3” (circle symbols) were drawn. In simplified terms, the upper curve here corresponds to the first two running meters of the screen deck, the middle curve to the first four running meters and the lower curve to the entire six running meters of the simulated screen deck. The steeper the partition curve, the higher the selectivity is to be considered. For further characterization, the parameters k50, k75 and k25 are defined. In the case of the screening processes considered here, these parameters are affected by the length dimension. The respective k50 value is the abscissa value to the partition number 50 % (cut point according to TROMP). The k75 and k25 values are the abscissa values to the partition numbers 75 % and 25 %, respectively. From the lower curve (V1.1+1.2+1.3) in Fig. 7, the cut point k50 = 0.851 mm can be read. The corresponding parameters k75 and k25 are 0.954 mm and 0.721 mm, respectively. A possible parameter with regard to comparison of separation characteristics is the imperfection, defined as (k75 – k25)/(2 k50). For the lower curve considered, the imperfection was 0.137. In simple terms, a low imperfection value means high separation efficiency. High imperfection values indicate low sharpness. If sections V1.1 and V1.2 are combined by calculation and the associated imperfection value is determined, the result is a comparatively higher value of 0.23 (simulated screen deck length only four linear meters).
The contents of Big Bag number 2 to Big Bag number 5 were available for the test series with the BIVITEC e+, and the associated test series were designated V2 to V5. In order to be able to exclude in particular the influence of possible manufacturing tolerances with the screen mats, the same set of screens was used for all of the total of 15 test sections, consisting of the same six BIVITEC screen mats in a fixed installation sequence. Accordingly, the screen mats of test series 1 were removed from the “classic” test machine and installed in the new BIVITEC e+ test machine for carrying out test series V2 to V5. In both types of screening machines, the dynamics of the screen mats have a significant influence on the separation characteristics. The setting parameters from the basic test series V1 described above were adopted and, if necessary, the oscillation amplitude was manually readjusted for the test series with the BIVITEC e+. In order to be able to exclude any influence due to different operation/sampling, the necessary activities (material loading, sampling, test observation, readjustment of the amplitude ...) were carried out by the same test personnel. A total of 35 aggregate samples were taken from the five test series. In order to obtain well-suited analysis sample quantities, the aggregate samples were appropriately tapered by means of riffle dividers. Reserve samples for any further analysis required were archived. With regard to the avoidance of the influence of different measuring instruments, the same devices (vibration amplitude meter, balances, stopwatch ...) were used in all test series. Regarding particle size analyses, the same standardized procedure was always used with the same analysis screens by the same personnel.
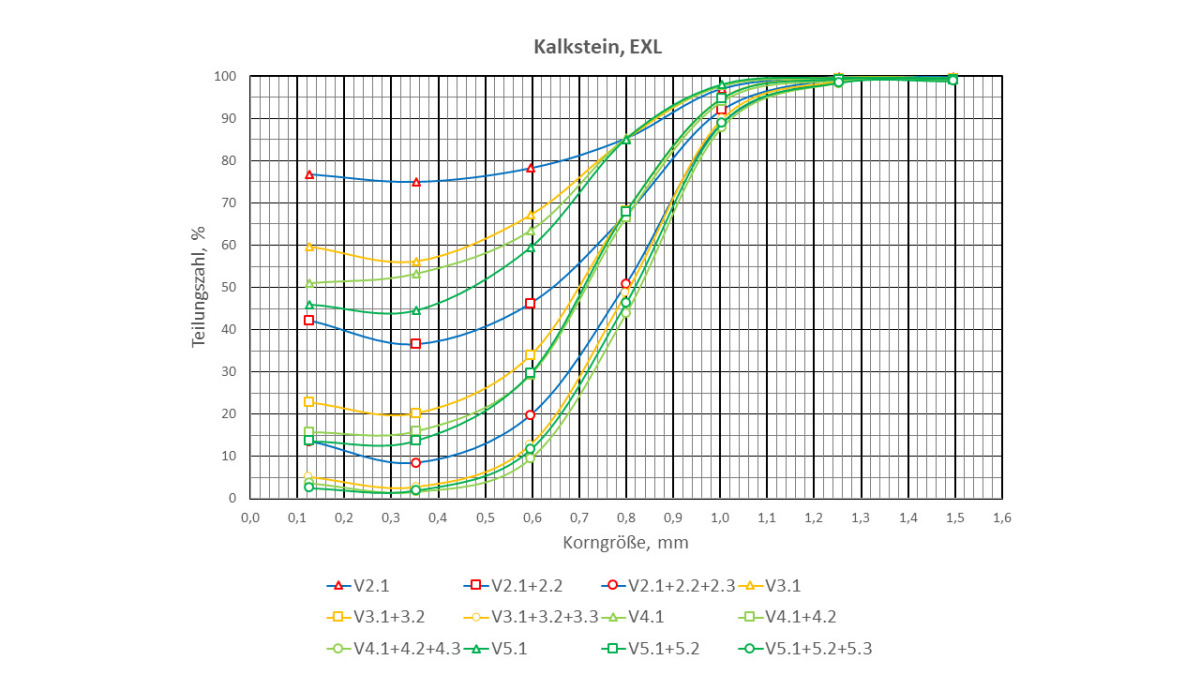
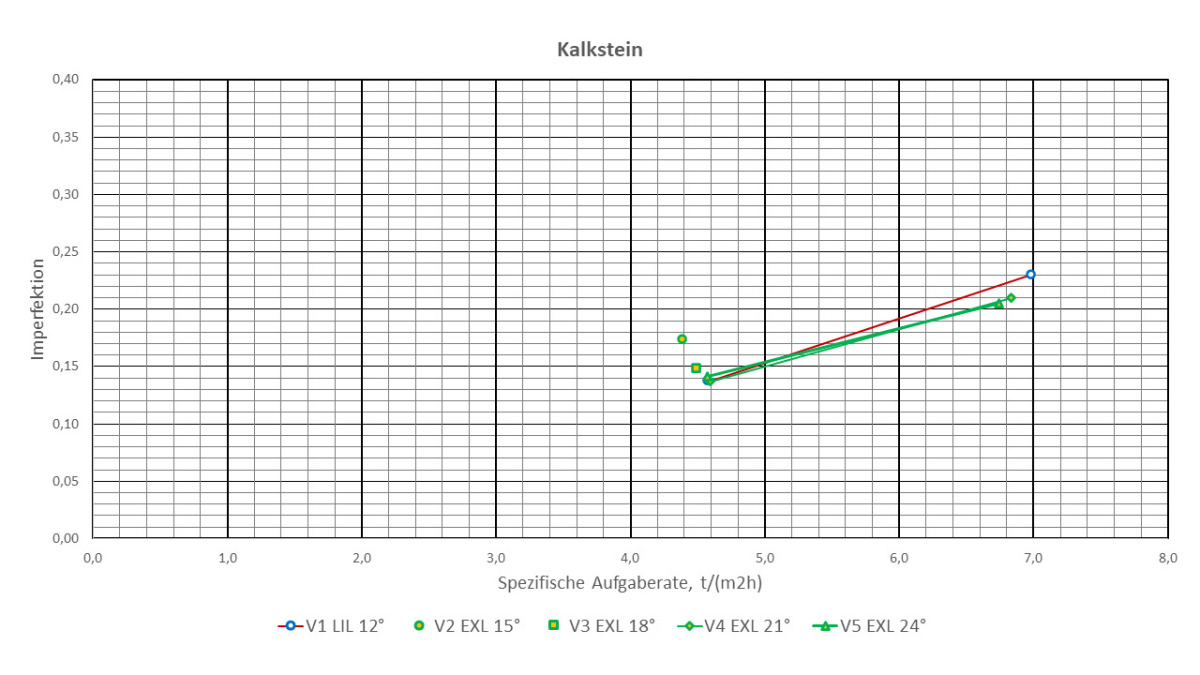
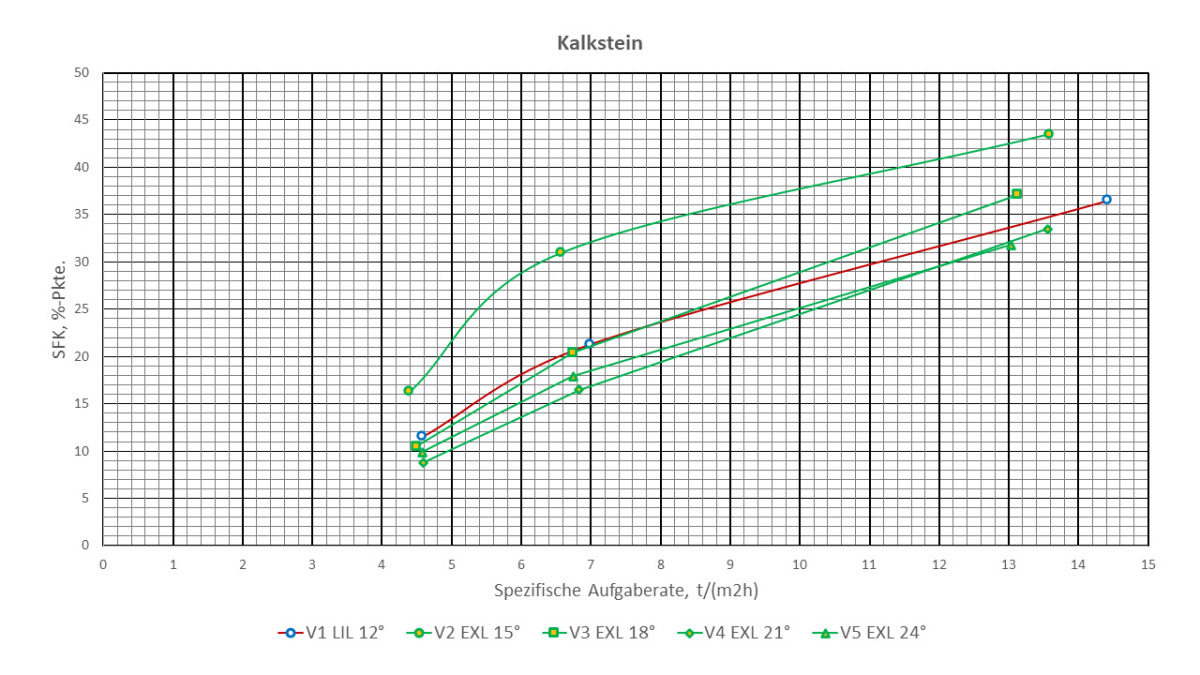
Fig. 8 shows the separation functions of the four test series V2 to V5 with the BIVITEC e+. These four test series mainly differ in the preset screen deck inclination. In test series V2, the screen deck inclination was set to an angle of 15°. In each of the subsequent test series, the inclination angle was increased by 3°. The evaluation of the collected test data allowed a comparison of the selectivity in three respects. In a first step, the corresponding imperfection values were calculated as described above and shown in Fig. 9 as a function of the respective specific feed rates. Due to the lack of fundamental oscillation in the BIVITEC e+, a correspondingly higher screen deck slope is required, as expected, to achieve high separation efficiency (test series V4 and test series V5). The screen deck inclination of 15° set for test series V2 is obviously too low to achieve high selectivity for this task. In comparison with the basic test series V1 (points shown as small blue circles, red curve), the separation efficiency of test series V4 and V5 is about the same or slightly higher (lower imperfection values). In a second step, the corresponding screening efficiencies were calculated and shown in Fig. 10 as a function of the respective specific feed rates. The definition of the screening efficiency here is the fine particle discharge into the screen underflow, whereby particles with particle sizes smaller than the nominal separation cut (< 0.8 mm based on classical screen analysis) were defined as fines. Again, it can be seen that to achieve high separation efficiency for this task, the screen deck inclination of 15° set for test series V2 is obviously too low (see data series “V2 EXL 15°”). The results of the basic test series V1 are again shown as small blue circles or as a red curve. With the higher screen deck slopes of test series V4 and V5, one can again speak of practically the same selectivity. In the sense of a third approach, a key figure with the designation “Summed contents of misplaced material” is to be used. The “Summed contents of misplaced material” SFK is defined as oversize content of the fines + undersize content of the coarse product and can be expressed in percentage points (% pts). At this point, it should be pointed out again that the comparative screening tests were not aimed at achieving the highest possible separation efficiency (low SFK values). The main objective was to compare the new BIVITEC e+ machine type with the “classic” design in terms of selectivity, as well as to quantify the required (higher) screen deck slopes. The SFK values can be calculated both for the individual test sections, as well as for computationally combined test sections in each case, and for the individual test series. Fig. 11 summarizes the evaluation results. The specific feed rate is again plotted on the abscissa. The small blue circles and the red curve indicate the basic test series V1. The relatively higher SFK values of test series 2 indicate, as expected, too low screen deck. In the case of test series V4 and V5, it is possible to speak of somewhat higher selectivity (relatively lower SFK values) compared to the basic test series V1. For example, in test series 4 (screen inclination 21°), the specific feed rate was 4.59 t/(m²h), the undersize content of the coarse product was 4.3 % and the oversize content of the fine product was 4.5 %. The associated SFK value is thus 8.8 % points. The evaluation of the basic test series V1 resulted in a worse SFK value of 11.5 %-points with approximately the same specific feed rate of 4.58 t/(m²h).
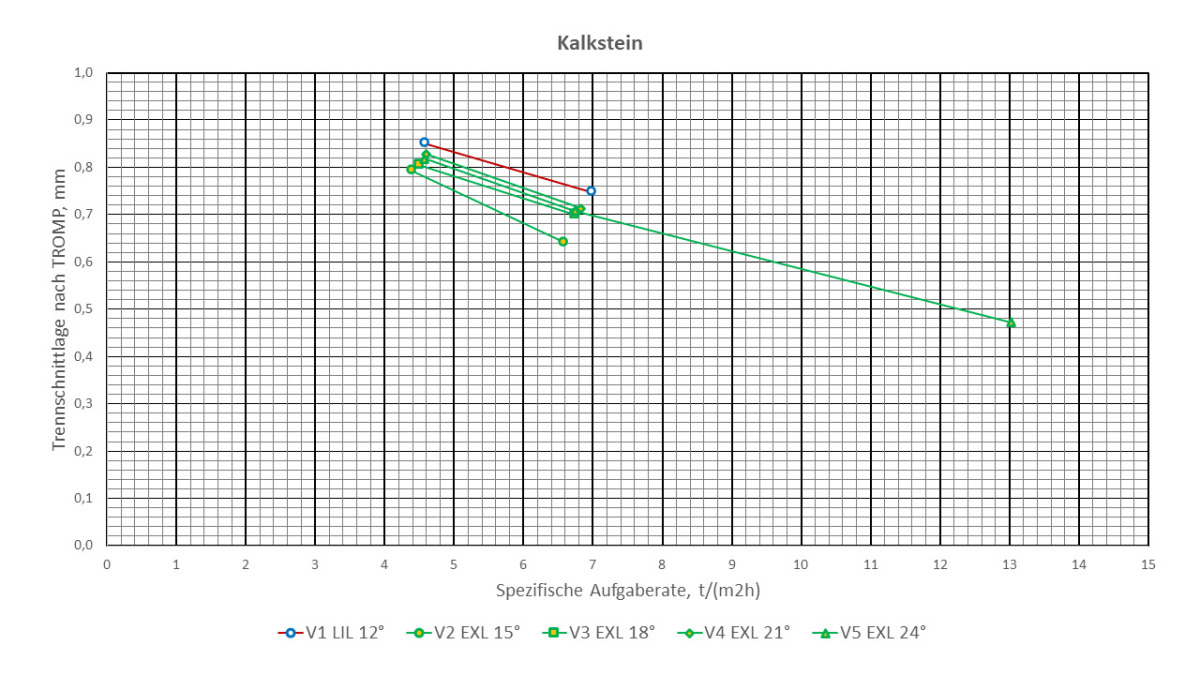
Fig. 12 summarizes the supplementary evaluation results graphically. The specific feed rate is plotted on the abscissa in the same way as in the three previous graphs. On the ordinate, the values of the respective cut points according to TROMP can be read off. The results for the screening tests with the BIVITEC e+ show relatively low cut points. This can be interpreted as follows: If the screen deck inclination is selected too low, a correspondingly lower separation efficiency is to be expected. The partition curves are flatter and lie correspondingly further to the left in the graph (see also Fig. 8). Lower k50 values are the result. At higher screen deck inclinations – which are necessary when using machines of the new BIVITEC e+ type series to achieve high separation efficiency – the “projected hole length” obviously plays a role. These “projected hole lengths” are correspondingly shorter at higher screen deck inclinations. The same hole sizes “act” like a slightly smaller hole length at higher screen deck inclinations. In practice, when using the BIVITEC e+, a short, slotted hole instead of a square hole can be provided at least in the feed side area of the screen deck, or a slightly longer slotted hole can be provided if slotted holes are generally specified. This shifts the separation cut to the somewhat coarser area according to TROMP. As an additional effect, a somewhat higher separation sharpness can be expected.
4 BIVITEC e+ case studies
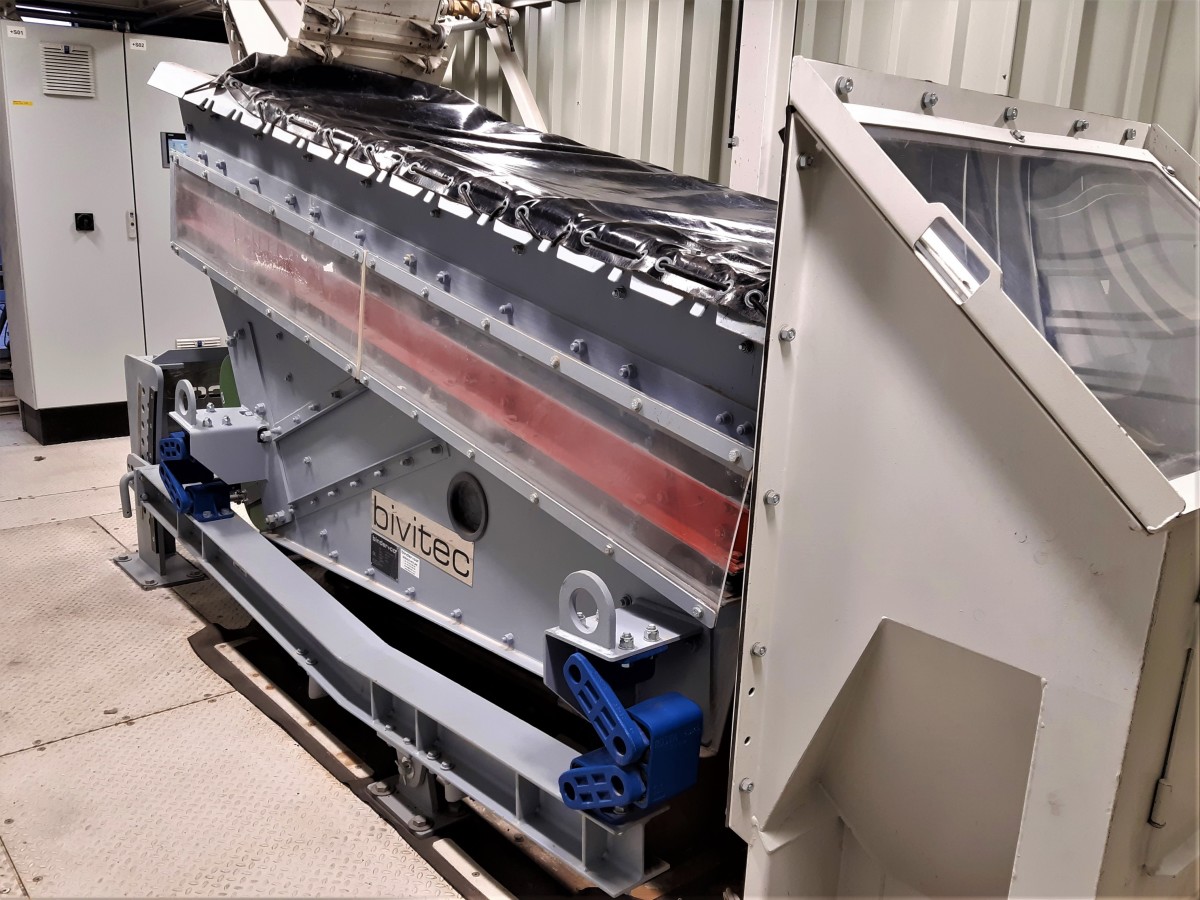
As a first example, a screening machine for fines removal from crushed sands is shown. Shell limestone is screened in a processing plant in southern Germany. Fig. 13a shows the machine without side covers. The upper floating frame is part of vibrating system 1, the lower floating frame belongs to vibrating system 2 (see also chapter 1 and Fig. 1). A pre-screened crusher product of nominal particle size 0/2 mm with a relatively high filler content – defined as proportion < 0.063 mm – is fed onto the screen deck equipped with 20 slotted punching mats (Fig. 13b). The screen overflow 0/2 mm with low filler content (de-filled crushed sand) is the main product and is fed via the coarse material chute into a silo below. Since in this new type of screening machine the screen box itself has practically no oscillating motion, this chute could be bolted directly to the screening machine. The screen box is mounted on the fines chute, which guides the screen underflow into the fines silo directly below and is rigidly connected to it. The inclination of the deck is 17°. The screen deck width of 1.9 m and the screen deck length of 6.7 m result in a screen deck area of 12.7 m² and, at a feed rate of 40 t/h, a specific feed rate of 3.1 t/(m²h). The rated power of the drive motor is only 5.5 kW.
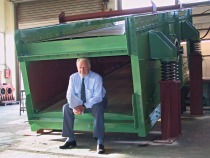
As a second case study, the screening of moist limestone is outlined. Approx. 65 t/h of crushed and pre-screened limestone of nominal grain size 0/16 mm are to be fed onto a double-deck BIVITEC screening machine. Each screen deck has an effective width of 1.3 m and an effective length – measured in each case from the first screen mat to the last screen mat – of 5.3 m. Practically two BIVITEC e+ single-deck machines bolted to each other are mounted one above the other (Fig. 14). The total nominal screening area is 13.8 m². The vibration characteristics can be infinitely adjusted separately for each screen deck and changed at the push of a button. Punching mats are used in the upper deck to realize the separation cut 8 mm. The punching mats of the lower deck allow the additional separation cut of 4 mm. This is followed by the three screening products 8/16 mm (overflow of the upper deck), 4/8 mm (overflow of the lower deck) and 0/4 mm (underflow of the lower deck). A drive motor with a nominal power of only 4 kW is installed for each screening deck.
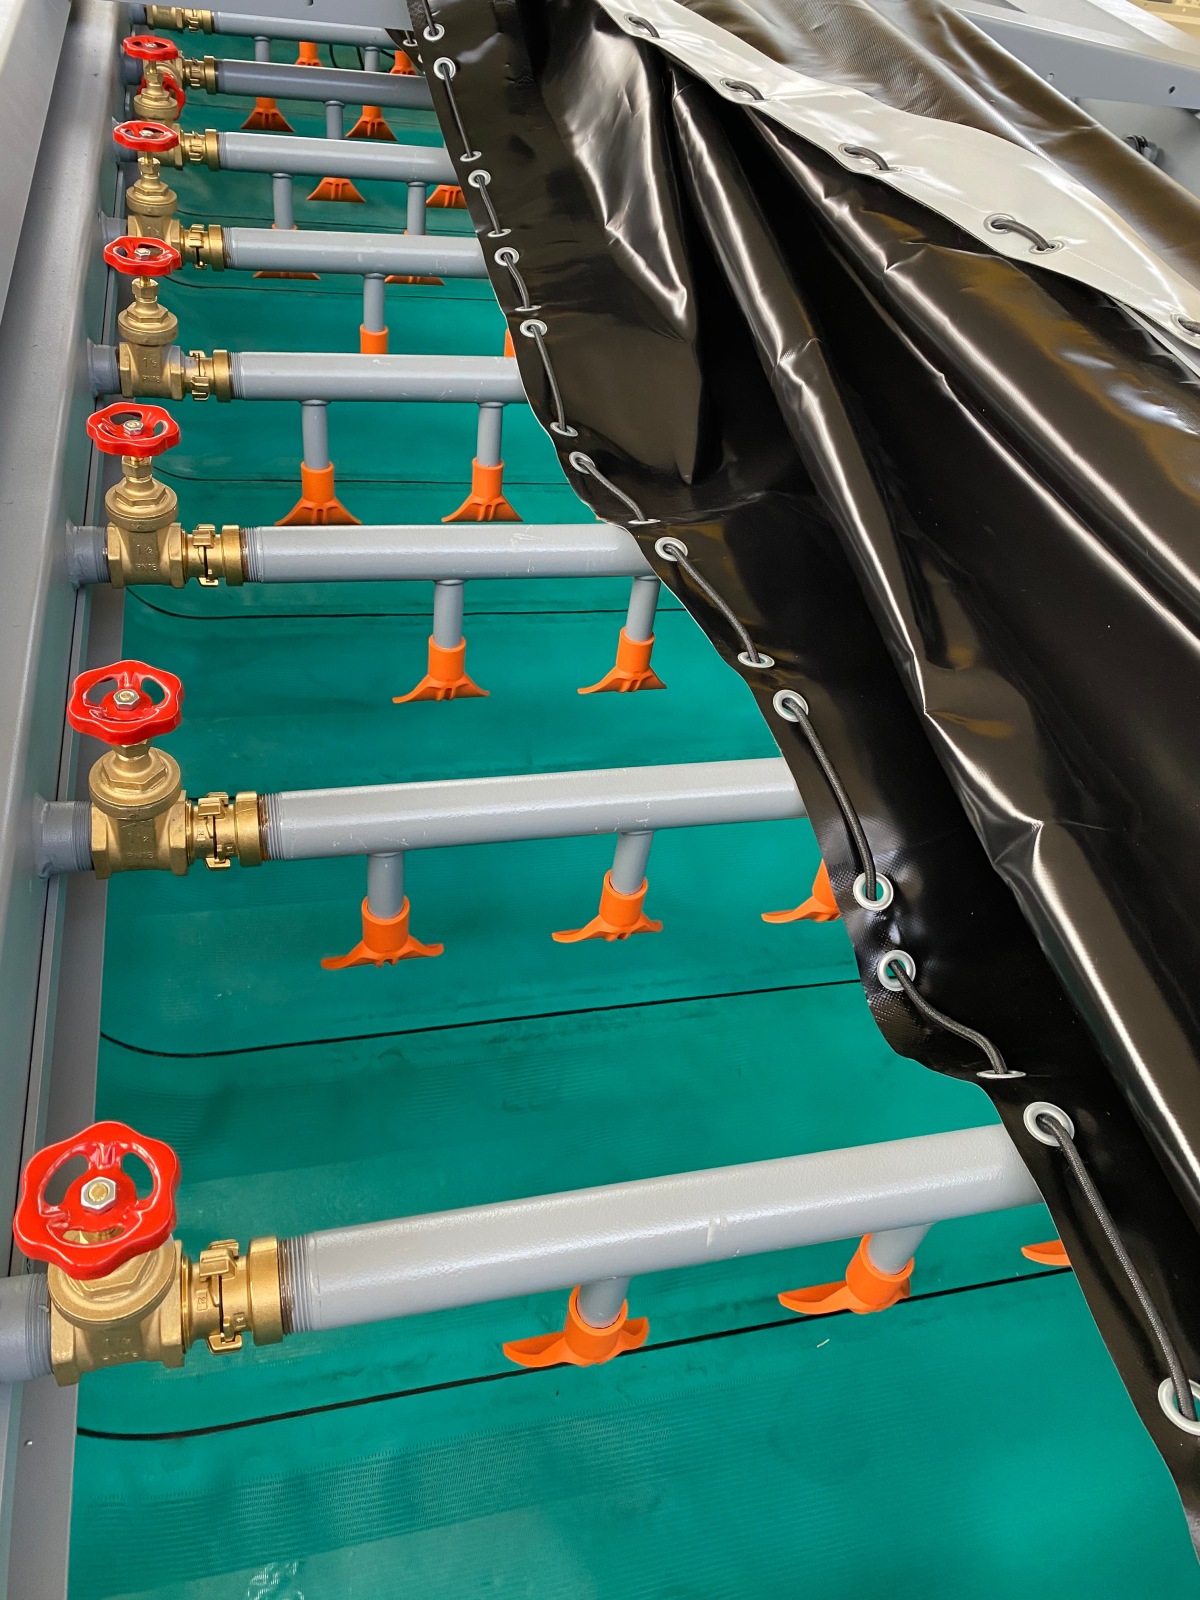
In the third project example, a double-shaft log washer, a 2-cell attrition machine, a screw classifier, a classic linear vibrating screen, a double-deck BIVITEC flip flow screen in “banana” design and the first BIVITEC e+ with spraying system are planned as core components for a talc processing plant. The above machines were designed, engineered and manufactured at Binder+Co in Gleisdorf and delivered to Brazil. The BIVITEC e+ is used for the realization of the 0.25 mm separation cut in a rod mill circuit and is equipped with a special spray system (Fig. 15). As special features of this novel design can be mentioned:
The spraying system is completely integrated into the stationary “BIVITEC e+ screen box”. (Screening box “wet screening” is identical with screening box “dry screening”)
No additional headroom
No protruding parts apart from the required water connection
Spraying tubes can be dismantled individually for quick and easy screen mat change (quick coupling on one side in conveying direction on the right, optionally on the left)
Rinsing tubes can be dosed or shut off individually
Drain nipple on internal shower water distribution pipe
Spray nozzles with variable nominal diameters (9 mm, 7 mm, 5 mm)
The inclination of the screen deck is 17°. The screen deck width of 1.9 m and the screen deck length of 6.7 m result in a screen deck area of 12.7 m². A crushing product of a wet-operated rod mill of nominal particle size 0/4 mm is fed. The feed slurry contains 15 t/h of solids. The screen overflow is returned to the rod mill, the fines slurry of nominal grain size 0/0.25 mm is product of the size recuduction circuit. The rated power of the drive motor of this screening machine is only 5.5 kW.
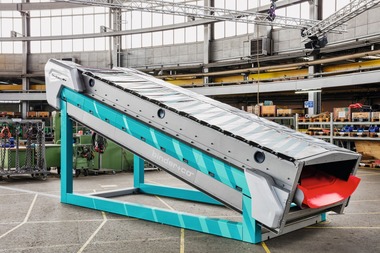
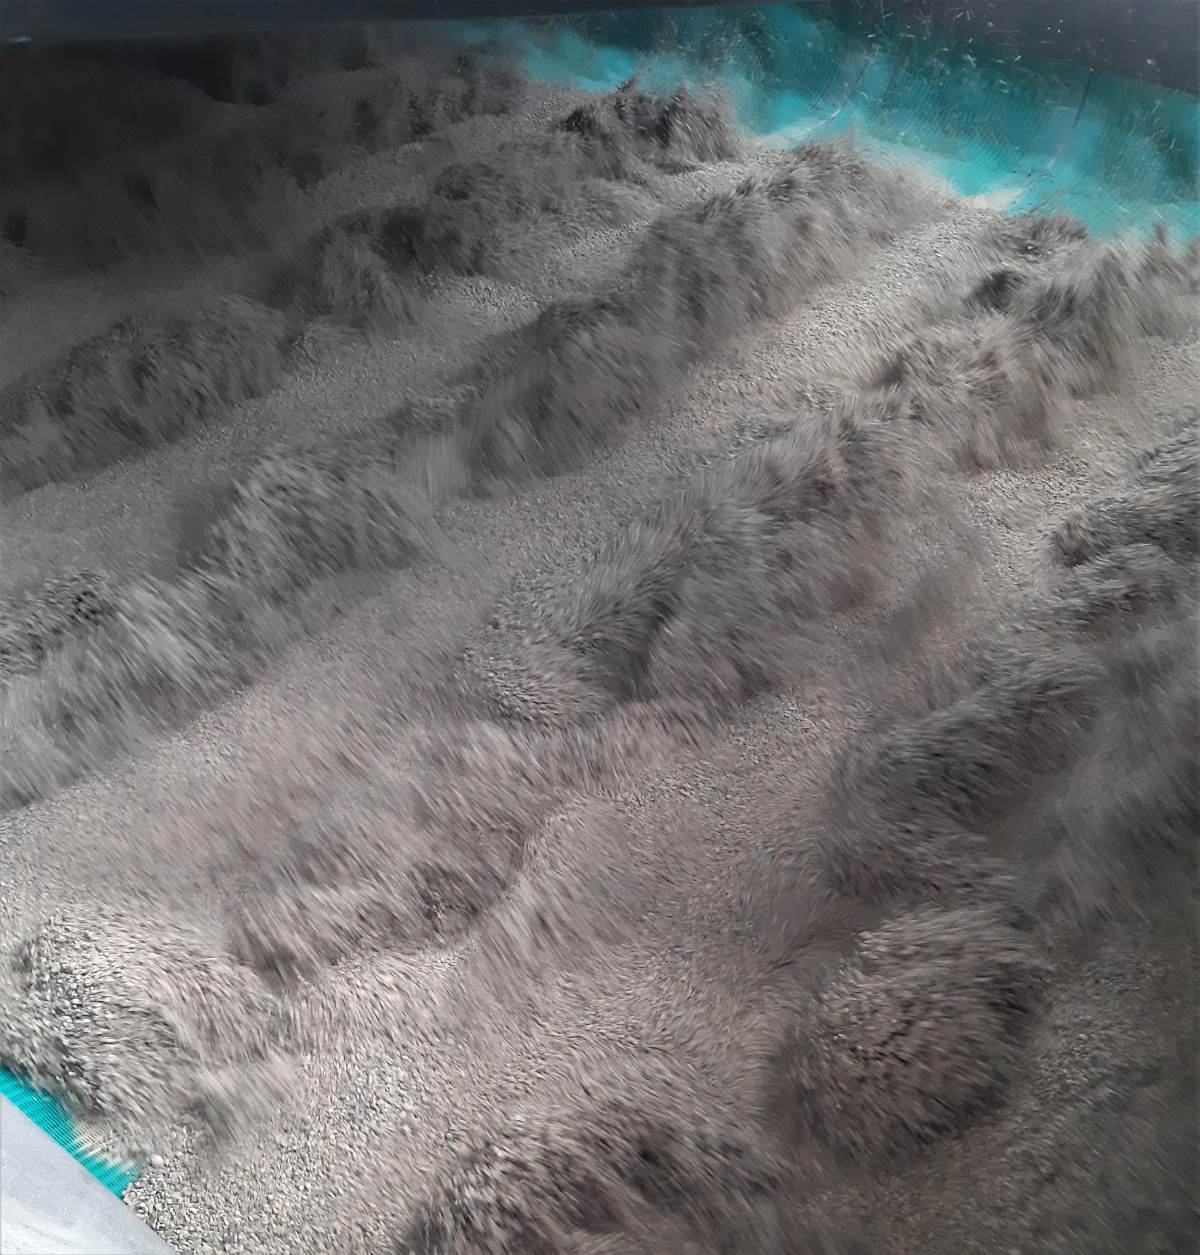
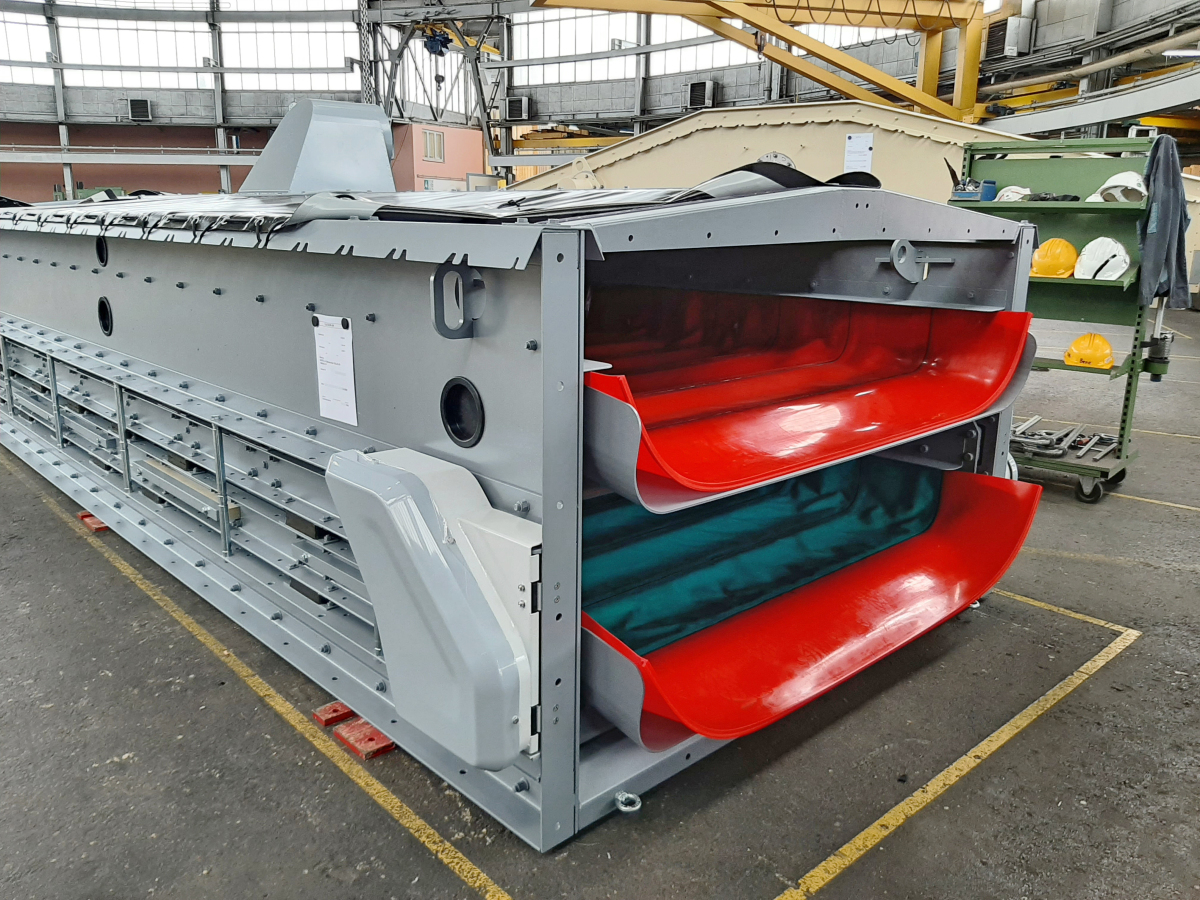
Fig. 16 shows a special design of a double-deck machine of the new type series in the production hall at Binder+Co in Gleisdorf. The two upper floating frames – one in the area of the right-hand screen cheek, one in the area of the left-hand screen cheek – are connected to the cross-members of both vibrating system 1 of the upper deck and vibrating system 1 of the lower deck to form a single unit (vibrating system 1). Similarly, the vibration system 2 is composed of the two lower floating frames, the cross members of vibration system 2 of the upper deck and the cross members of vibration system 2 of the lower deck. The vibration characteristic can again be continuously adjusted. In this design variant, however, it is the same for both screen decks and cannot be changed separately. In this project, the lower deck was decisive for the process engineering screening machine design. The upper deck is, as it were, somewhat oversized; the vibration characteristics can thus be optimized accordingly for the lower deck. The main advantage of this type of machine is the low overall height of the double-deck screen box. The screen box height of the type EXL/DD-2S 1900 x 6 described here is only 1437 mm. In comparison, a double-deck design with the type designation EXL/DD 1900 x 6 – practically consisting of two “stacked” single-deck machines – would have a total screen box height of 2056 mm. Another advantage of the EXL/DD-2S type is the reduced number of mechanical and electrical components. The screen deck width of 1.9 m and the screen deck length of 6 m result in a total screen deck area of 22.8 m². The installed nominal power is 11 kW. This machine has already been integrated into a plant for the preparation of shell limestone in 2021. A pre-screened nominal grain size 0/5.6 mm is fed, the upper deck handles the separation cut 2 mm (red screen mats), the lower deck is used for fines removal (screen mats in turquoise color). The overflow of the upper deck is called product 2/5.6 mm, the overflow of the lower deck is called product 0/2e (product 0/2 mm with correspondingly low content of fines < 0.063 mm). The underflow of the lower deck can be called filler product (fine by-product).
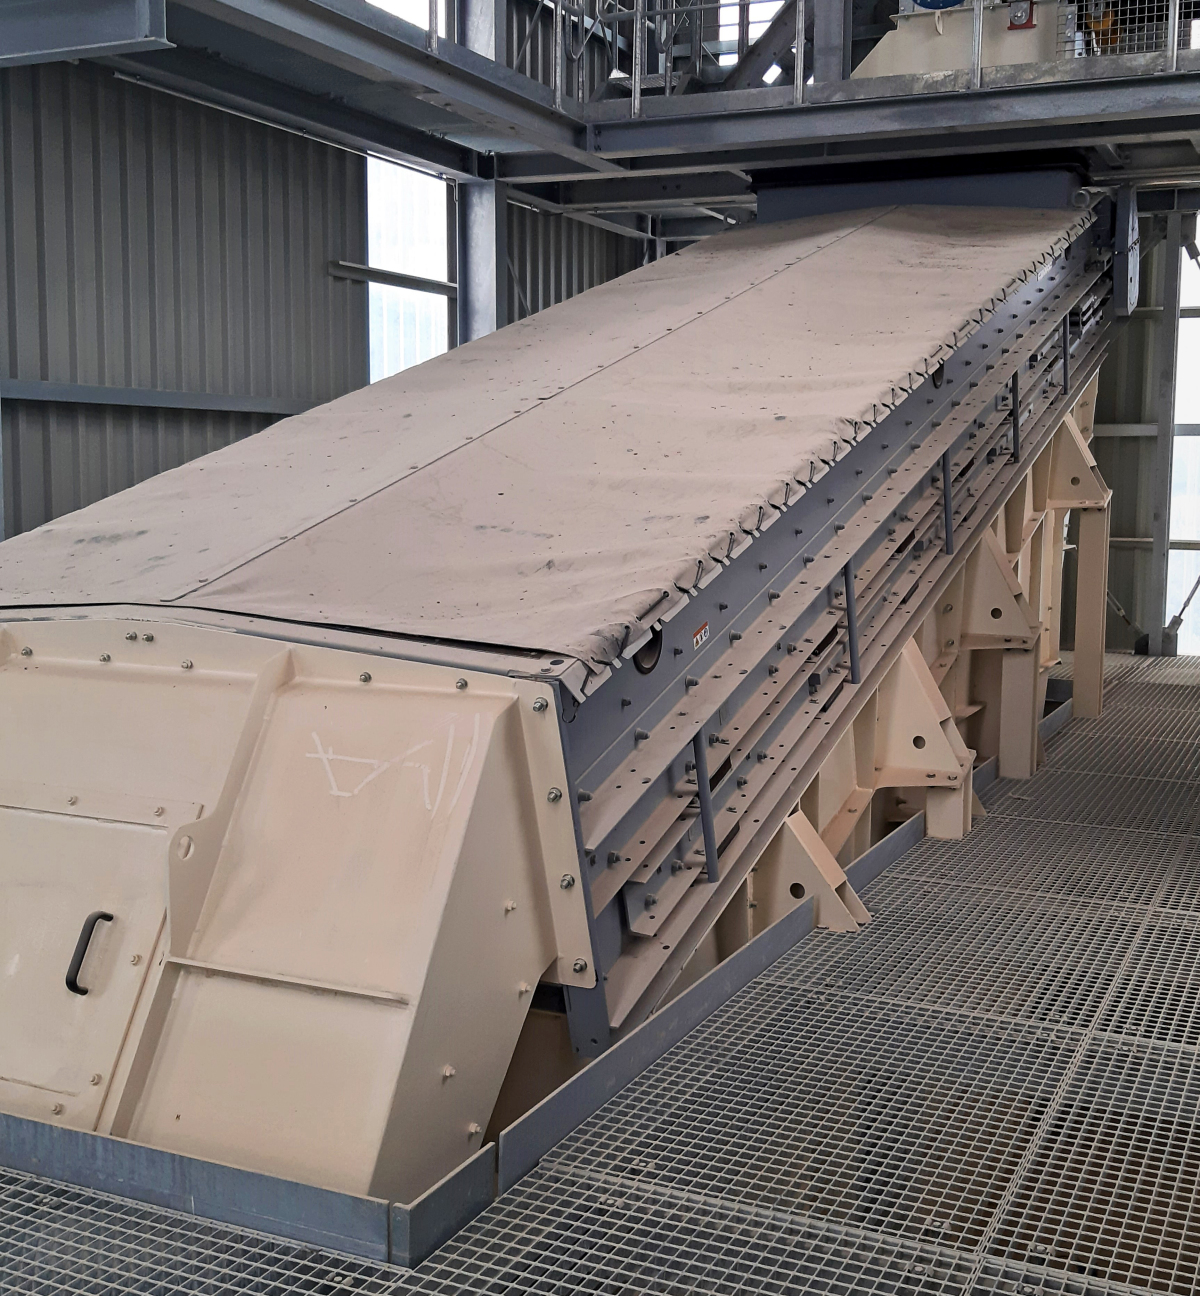
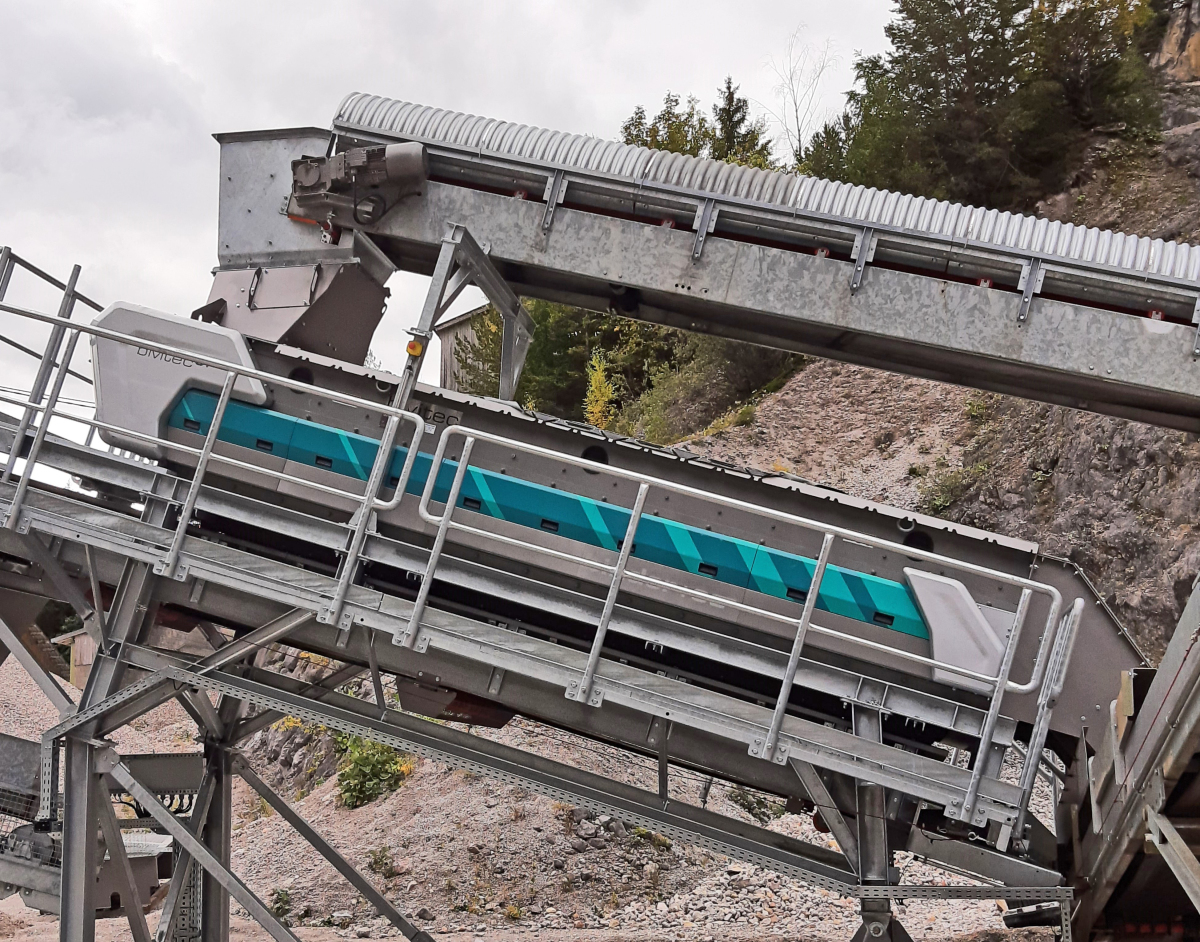
The fifth case study shown is a screening machine for screening limestone at a separation cut of 4 mm. The machine was originally intended for the IFAT 2020 (Trade Fair for Water, Sewage, Waste and Raw Materials Management) in Munich as an exhibit at the Binder+Co stand. In 2021, the machine was integrated into a crusher circuit in Austria. Fig. 17 shows the machine with the floating frame covers (upper cover in turquoise color scheme). The crushing product of a vertical impact crusher of nominal particle size 0/11 mm with a maximum particle size of 16 mm is fed onto the screen deck equipped with 14 slotted punching mats. The screen overflow passes through a coarse material chute flanged to the non-oscillating screen box onto a conveyor belt and is returned to the crusher as a recirculating stream. The underflow chute is also directly connected to the screening machine and the fines conveyor below it in a practically dust-tight manner, which transports the end product of nominal grain size 0/4 mm with an oversize content of < 10 % to free stockpile. Due to the extremely low dynamic load, the substructure could be designed accordingly light and cost-efficient. The inclination of the deck is 18°. The screen deck width of 1.6 m and the screen deck length of 4.7 m result in a screen deck area of 7.5 m². The rated power of the drive motor is only 4 kW.
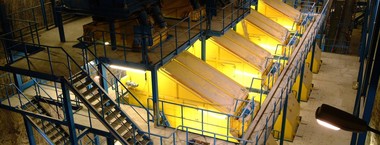
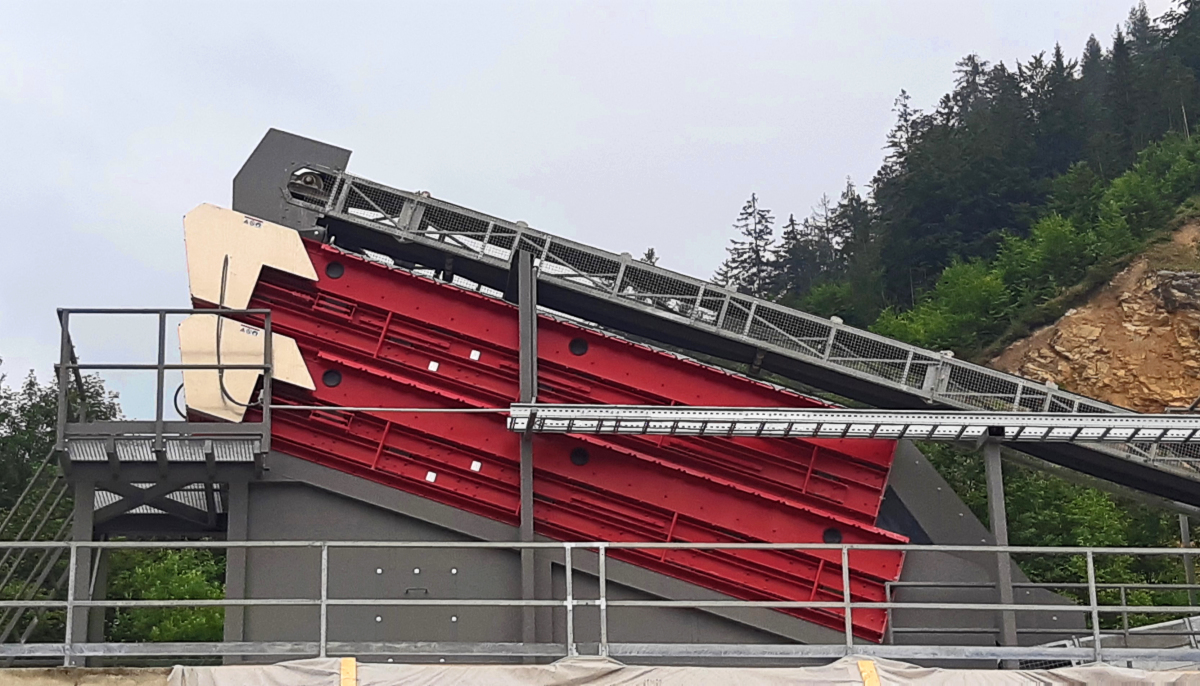
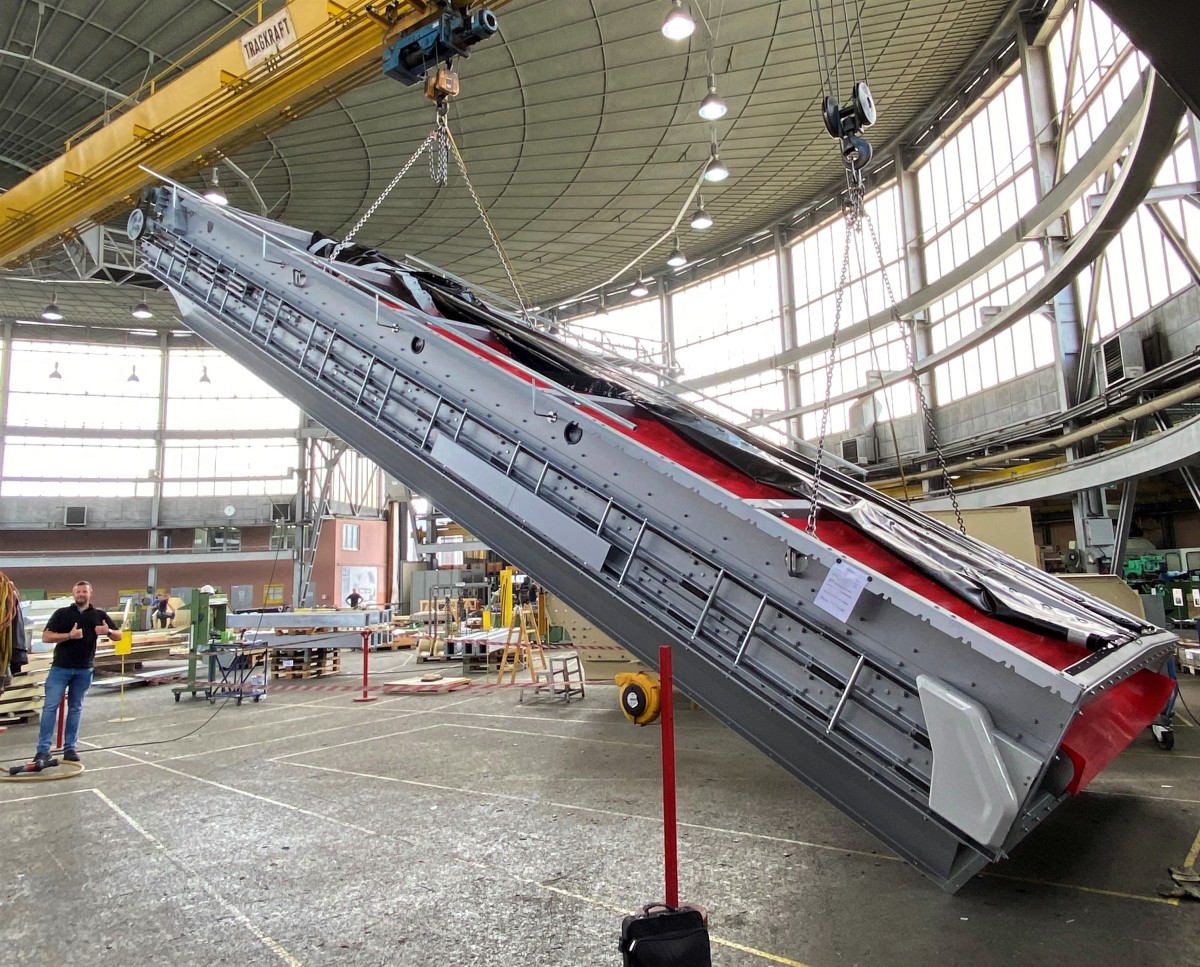
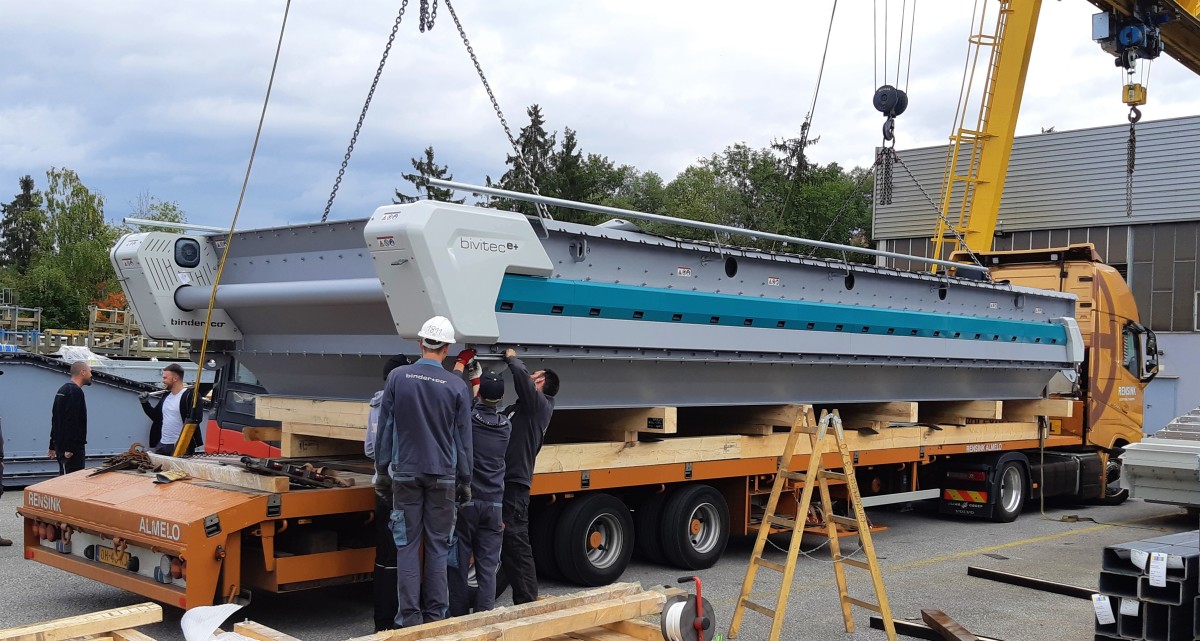
By the end of 2021, 23 screening machines of the new type series BIVITEC e+ have already been sold. The screens are designed for different tasks for the processing of primary raw materials and secondary raw materials. As a final example of this article, a task from the wood processing industry is outlined. On the basis of several screening tests carried out in the Binder+Co pilot plant, it was possible to design a single-deck machine with a screening surface area of 35 m². The feed material is sawdust with particle sizes in the range 0/20 mm. The effective screen deck width of this machine is 3.5 m. The 30 screen mats are designed for a nominal separation cut of 3 mm and result in a screen deck length of 10 m. Two small electric motors with a rated power of 5.5 kW each serve as drive. Fig. 18a shows the machine in the assembly shop and Fig. 18b during loading in the open-air area at Binder+Co in Gleisdorf.
5 Outlook for BIVITEC e+, areas of application and
additional functions of the “classic” BIVITEC
The machines of the new BIVITEC e+ series will be the clearly better choice for many projects, both in terms of investment and operating costs. However, there will also be many tasks in the future where “classic” BIVITEC screening machines will be used. As fields of application and additional functions of these “classic” machines the following list can be mentioned:
Fine to coarse separation cuts (protective deck design possible)
Half deck for additional cut points possible
Conveyor floor for medium products or fines optionally possible
“Banana” design (e.g. for high fines content)
Lower screen deck inclination due to screen box basic vibration
Higher feed rates
Literature
[1] Anibas F.: Innovative, energiesparende Klassierung von siebschwierigen und nichtsiebschwierigen Aufgabematerialien. BHM Berg- und Hüttenmännische Monatshefte (2020), 165. Jg. Heft 8, S. 381-386
[2] Gschaider, H. J.; Kalcher, A.: Qualitätssteigerung von Brechsanden durch siebtechnische Abscheidung von Feinststoffen, Aufbereitungs Technik, 42 (2001), Nr. 7, S. 328-335
Author:
Dipl.-Ing. Dr.mont. Helfried Gschaider, Product Manager
Binder+Co AG, Gleisdorf/Austria
Helfried Gschaider studied mining engineering, elective subject processing, at the University of Leoben/Austria. From 1991 to 1997, he was first a contract assistant for the processing of industrial projects and then a university assistant at the Institute for Processing and Refining of this university. Since November 1997, he has been working for Binder+Co AG in the areas of process engineering, product management, project planning and sales, focusing on screening technology, wet processing and sensor-based sorting.
Other Author:
Ing. Rainer Eixelberger, Deputy Technical Center Manager
Binder+Co AG, Gleisdorf/Austria