Leading Investments
Is the US mining industry going to move abroad?Summary: The US mining industry is again enjoying a period of substantial growth. Strong investments are being made and there is also a great deal of domestic potential. On the other hand, leading US mine owners are also increasingly engaging in activities abroad. Taking a selected number of very important mining industries as an example, this report deals with the existing relationships and discusses the current market trends.
1 Introduction
In the global mining industry in the first six months of 2011, more than 1300 company takeovers took place and transactions with a volume of US$ 71 bn were registered [1]. US-American companies were responsible for 31 % of the acquisitions and were thus considerably more active than Canadian (19 %) and Chinese (7 %) firms. Among the biggest deals were the takeover of Massey Energy by Alpha Natural Resources for US$ 8.5 bn, the takeover of Consolidated Thomson Iron Mines by Cliffs Natural Resources for US$ 4.9 bn and the purchase of International Coal by Arch Coal for US$ 3.4 bn. 20 % of the US$ 71 bn acquisitions took place in the USA, 40 % in Canada, 14 % in Australia and 7 % in China. This clearly demonstrates the high strategic importance placed on the North American and especially the US-American mining industry.
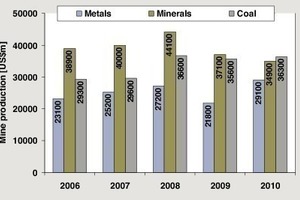
The USA is responsible for 19.7 % of the global gross national product and is thus the world‘s foremost economy. However, differing from most other developed countries, the USA has a very strong mining industry, which in 2010 achieved a production volume of US$ 100.3 bn (Fig. 1). The relative share of coal and metal mining has significantly increased compared to other minerals. In 2006, minerals still had a share of 42.6 % in total mining output but had dropped to 34.8 % by 2010. At the same time, metalliferous ores increased from 25.3 % to 29.0 % and coal rose from 32.1 % to 36.2 %, giving it the largest share in national mining output. Following coal, the most important metals are gold, silver, copper, lead, zinc, molybdenum and palladium. Table 1 presents the US mining production of these metals and the respective shares of the world market.
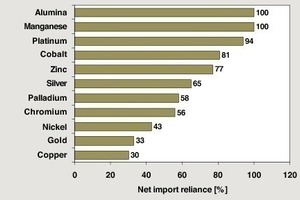
However, Fig. 2 shows that, despite the output of its own mining industry, the USA is still highly dependent on importation of essential metals. For example, one third of the gold is imported, i.e. the 230 tons produced in the USA only cover 2/3 of the country‘s requirements. In the case of silver, the ratio is 2:3, i.e. almost 2/3 of the demand for silver is covered by importation. Based on the US production of 1280 tons, this means that around 1970 tons have to be imported. In the case of zinc, 77 % is imported and with cobalt the figure is 81 %. The entire consumed quantity of manganese and bauxite is imported. These are good reasons for the efforts being made by US companies to extend their spheres of influence outside the USA. On the other hand, some companies are of the opinion that the USA no longer provides enough growth potential.
2. The most important mining industries
Coal reserves in the USA are estimated to be around 260 bn tons. At the present production rate of 1085 million tons (all figures are given in short tons), this means that the reserves will last about 240 years. 9/10 of the mined coal is consumed by power supply utilities, as around half of the electricity generated in the USA comes from coal power stations. However, more than 70 % of the existing coal power stations are already over 30 years of age and there is no sign at present of new construction projects. In 2009 the country had 1407 coal mines, down from 1458 mines one year previously. The production capacity was 1,395 million tons, of which 440 million (31.5 %) came from underground mining and 955 million tons (68.5 %) came from strip mining. The industry is relatively strongly fragmented. As many as 29 companies mined more than 5 million short tons (MST) of coal in 2009.
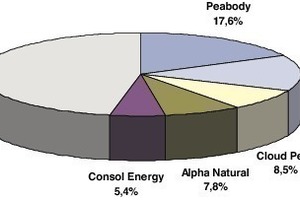
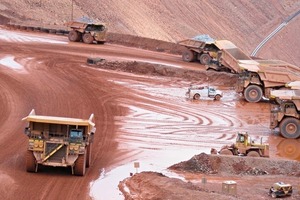
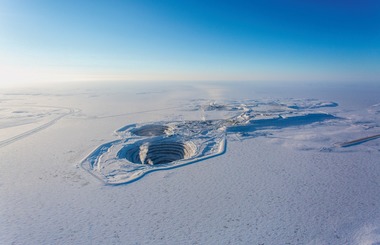
As shown in Fig. 3, the market leader in the USA is Peabody Energy Corporation with an output of 189.2 MST. Peabody‘s North Antelope Rochelle Mine is the largest coal mine in the USA, with an output of 98.3 MST. In total, the company owns 17 mining operations (Fig. 4) in the USA and 28 worldwide. In the USA, the company is expecting to increase its production capacity by 15 MST up to 2015 by organic growth. In 2010, the company produced a total of 246 million tons of which 79 % came from domestic sources. Arch Coal takes 2nd place in the US rankings with 148 MST. This company operates 23 coal mines in the USA, with 15 of them located in the Appalachian Mountain region. The purchase of International Coal boosted the firm‘s production output to 179 MST and increased its reserves to 5.5 bn tons.
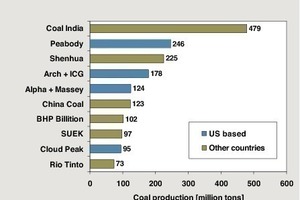
The further places in the TOP 5 are occupied by companies with production outputs of 50 to 100 MST: Cloud Peak Energy (91 MST), Alpha Natural Resources (83.5 MST) and Consol Energy (58 MST). Alpha‘s recent takeover of Massey Energy has increased its production capacity to 124 MST. US companies also occupy leading positions internationally (Fig. 5). Four US companies are in the global TOP 10. The leading US companies seem in a good position to achieve further growth. Apart from its mines in the USA, Peabody owns operations in Australia, Indonesia, China and Mongolia. Whereas the company‘s operations were almost entirely within American territory up to 2003, 53 % of its capacity will be located outside the USA in 2011. Up to 2015, Peabody is set to achieve growth of approximately 100 MST in Asian countries alone.
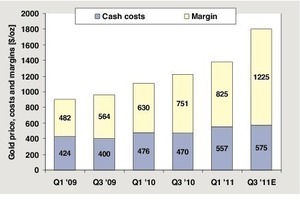
In times of crisis, gold and silver are regarded as a safe capital investment. Currently, this has significantly driven up the price of gold and provided gold producers with skyrocketing profits (Fig. 6). From the 1st quarter of 2009 to the 2nd quarter of 2011, gold prices rose by 66 %, resulting in a 90 % increase in profits. At the expected gold price of 1800 US$/oz in the 3rd quarter of 2011, profits will even have risen to 154 %. In this connection, it should be noted that US gold producers have the lowest operating costs in the world. This means that practically all US gold mining companies are profiting from current developments and as a consequence their output rates have shown a slight upturn for the first time since 2000, rising by 3 % to 230 tons. In 2000 the gold production figure was still 355 tons.
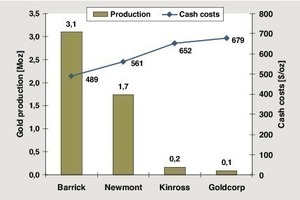
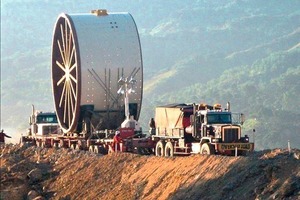
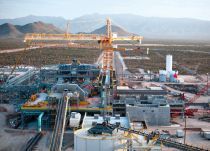
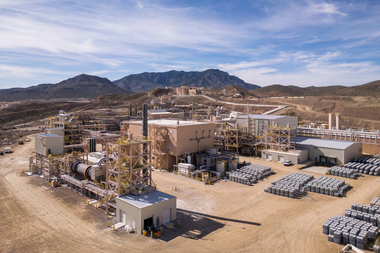
The federal state of Nevada currently accounts for 70 % of the total gold production. Other states achieving significant production rates are Alaska, Arizona, California and Colorado. Fig. 7 shows the biggest gold producers in Nevada and their cash costs. A relationship can be seen between production rate and production costs. Barrick Gold is the leading company, not only in America, but worldwide. It owns 8 mines in the USA, 7 of which are located in Nevada and one in Montana. A further mine is located in Canada. Barrick‘s North American assets accounted for 41 % of the company‘s gold production in 2010. In recent years, Barrick has tended to concentrate on a few large mines. Its present major projects are the Cortez mine in Nevada and the Pueblo Viejo mine (Fig. 8) in the Dominican Republic, which is scheduled to come on stream in mid 2012. 38 % of the company‘s current exploration budget is dedicated to North America.
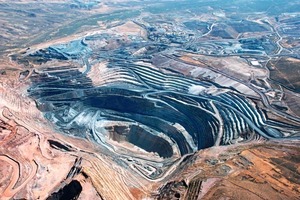
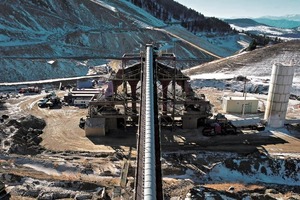
Newmont‘s Carlin Trend Mine (Fig. 9), which has been in operation since 1965, consists of several mine complexes. Gold Quarry, opened in 1985, is currently the largest of the 14 open pit and 4 underground mines owned by Carlin Trend. In 2011, the company plans to mine 1.8–1.9 million ounces (Moz) in this Nevada facility. From 2012 to 2017 the mine is to be further extended by 0.4 Moz per annum for a capital expenditure of US$ 1.3 bn. Among the other important gold producers in the USA are Kinross, AngloGold Ashanti (Fig. 10), Kennecott Utah Copper, Sumitomo Metal Mining, Goldcorp, Hecla Mining and New Gold. A not inconsiderable percentage of the produced gold is obtained as a “byproduct” of copper ore mining. For instance, most of the gold mined in Arizona comes from copper ore operations. It is a similar situation in the case of silver, some of which is a byproduct of gold and copper mining.
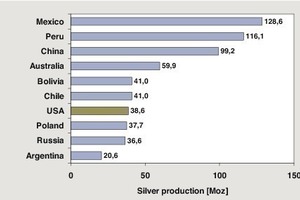
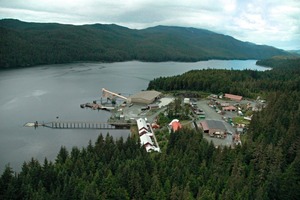
In the international silver mining ranking, the USA is in 7th place with its latest production figure of 38.8 Moz (Fig. 11). The leading nations are Mexico, Peru and China. Coeur d’Alene Mines and Hecla Mining are the only two US companies represented in the TOP 20 silver producers. Coeur is the biggest producer with an output of 16.8 Moz of silver from its Rochester „Flagship“ Mine in Nevada. In addition to silver, this mine produces 0.16 Moz of gold. In 2011, when the company starts up the Kensington Mine (Fig. 12) in Alaska, it expects to achieve an output of 19.5–20.5 Moz of silver and 0.24–0.25 Moz of gold. Coeur has further activities in Mexico, Bolivia, Argentina and Australia. Hecla Mining is currently producing silver at its Greens Creek mine in Alaska (Fig. 13) and Lucky Friday mine in Idaho. Hecla‘s annual output rate of silver is 9–10 Moz. It is currently developing two further projects in the USA and one in Mexico.
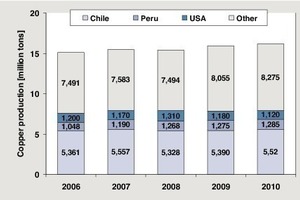
The USA is one of the biggest copper producers in the world. However, its second place in the ranking behind Chile, which it took in 2008, has since been lost again to Peru (Fig. 14). In 2010, the USA‘s production rate again declined, losing 5 % on the preceding year and falling to 1.12 m tons. The main US states with significant output quantities are Arizona, Utah, Nevada, New Mexico and Missouri. Although there is a total of 28 mines, almost 99 % of the production comes from just 19 mines. A large portion of the US copper consumption is covered by imports from Chile, Canada, Peru and Mexico. The price of copper has only risen slightly in the last few years.
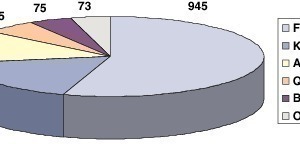
Fig. 15 shows the domestic copper production capacities of the most important US companies. Just one company, Freeport-McMoran (FCX), accounts for 55 % of US capacity or 1.72 million tons, and thus also takes second place in the global ranking behind Codelco and before BHB Billiton and Xstrata. In the USA, FCX owns the Moreci, Bagdad, Sierrita (Fig. 16), Safford and Miami mines in Arizona and the Tyrone and Chino mines in New Mexico. In 2011 it expanded capacity in Morenci and between 2012 and 2014 it plans to expand Miami and Chino. The company is also implementing major expansion projects in South America (Cerro Verde, El Abra Mill) and in Africa (Tenge). Other companies with significant capacities are Kennecott Utah Copper and Asarco with 0.3 and 0.23 million tons respectively. Asarco owns three copper mines in Arizona: Mission, Silver Bellund and Ray. Kennecott, a member of the Rio Tinto Group, also produces gold and molybdenum as important byproducts of its copper operations.
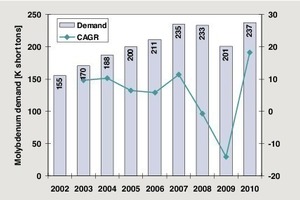
In 2010, molybdenum – needed for the manufacturing of high-grade steels – was produced in eight mines in the USA. With its annual output rate of 56 000 tons, the USA is second to China (94 000 tons) on a global scale and is responsible for 24 % of the world‘s molybdenum production. The other important molybdenum producing nations are Chile, Peru, Canada and Mexico. After consumption rates stagnated up to 2002, molybdenum consumption dramatically increased (Fig. 17). However, the global economic crisis and the resultant slump in demand for high-grade steel caused a marked decline before the upswing in 2010 brought a new peak. From 2009 to 2010, the greatest consumption increase took place in China with a jump of almost 25 % to 74 300 short tons. In the same period the USA had a consumption figure of 33 800 short tons.
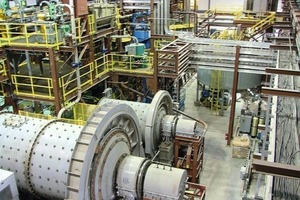
The US mining capacity is currently 73 200 metric tons, but it should be noted that this figure includes mines that were temporarily closed in 2008 and 2009. Worldwide, 60 % of the mined molybdenum is obtained as a byproduct, usually in copper mining operations. Copper contents of 0.5 to 1.5 % (i.e. 5 to 15 kg/t of ore) are typically accompanied by molybdenum contents of 0.1 to 0.5 kg/t of ore. In the USA, molybdenum is obtained as a primary product in only a few mines. These are the Henderson Mine owned by Freeport-McMoRan (FCX), the Thompson Creek Mine (Fig. 18) in Idaho owned by Thomson Creek Metals (TCM), the Questa Mine in New Mexico owned by Chevron Mining and the Ashdown Mine in Nevada owned by Win-Aldrich. The Henderson Mine works one of the biggest molybdenum deposits ever discovered. Since the mine was started up in 1976 it has produced around 0,35 million tons of molybdenum. In 2012, the FCX subsidiary Climax Molybdenum is going to start production at the Climax Mine (Fig. 19) in Colorado and expects to be mining about 9000 tons per year in 2013.
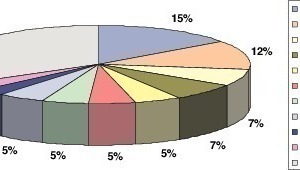
FCX is also the leading global producer (Fig. 20). In 2009 its molybdenum output, all of which came from the Henderson Mine (35 000 tons in 2010), made up about 15 % of the worldwide production figure. Codelco, obtaining its molybdenum as a byproduct of copper mining operations, is in second place. Southern Copper Corp. is a producer in Peru. The biggest Chinese producers are Huludao Molybdenum, China Molybdenum and JDC (Jingduicheng Molybdenum Group). More than 10 other Chinese manufacturers make up a market share of approx. 16 %. Rio Tinto‘s Kennecott Copper and Thompson Creek Metals respectively account for 5 % and 4 % of the world market. The Chilean and Peruvian producers Antofagasta and Antamina occupy the last places in the TOP 10 ranking.
3. Prospects
In the USA, the coal industry and the metal mining industry have provided secure jobs in recent years. However, some companies are now showing signs of moving out of the country. The often-stated reasons are that suitable locations are becoming increasingly difficult to find, and that licensing procedures are getting more and more complicated and time-consuming, so that mine site development now takes 5–7 years. In view of this trend, import rates for numerous metals may well increase in order to cover rising demand in the USA. At present, the coal industry is living from the high demand in the domestic power generating industry. In this connection, many mine owners are worried about the slow pace of conventional coal-fired power station refurbishment. If refurbishment projects undergo further delays and more of the older power stations have to be shut down, domestic demand for coal will decline. The coal industry‘s exports are naturally profiting from China‘s booming demand for coking coal and steam coal. However, on the export market the US industry is facing growing competition with such countries as Australia and Indonesia.

