Mining industry in the USA – one year after the elections
 © MP Minerals
 © NMA
© NMA
 © USGS
![3 US metal ore deposits [1]](https://www.at-minerals.com/imgs/2/3/1/6/0/4/1/03_Bild3L_Mineral_Commodity_Summaries_2025-b913b662efc5df2a.jpeg)
![4 Palladium supply [2]](https://www.at-minerals.com/imgs/2/3/1/6/0/4/1/04_Bild4L_palladium-6f9bf1c4d1bb9051.jpeg)
![5 Palladium scenarios [2]](https://www.at-minerals.com/imgs/2/3/1/6/0/4/1/05_Bild5L_Szenarios-594f258cbec5f086.jpeg)
![6 Overview of critical raw materials [2]](https://www.at-minerals.com/imgs/2/3/1/6/0/4/1/06_Bild6_U.S._List_of_Critical_Minerals_L-ae1af08447bd8337.jpeg)
 © NMA
© NMA
 © NMA
© NMA
 © Peabody Energy
 © MP Materials
 © MP Materials
 © Cochilco
 © Cochilco
 © Cochilco
 © FCX
© FCX
 © Coeur Mining
 © Barrick Mining
 © Rio Tinto
 © Kinross Gold
A golden age has to come for the USA. But what of this has already dawned in the mining sector? In the following report, the first measures introduced by the Trump administration are presented. The author details how these measures have impacted the mining industry and what has actually changed. Critical materials are regarded as a national security priority, but what exactly is behind this?
1 Economic development in the USA
The new administration of the United States of America (USA) under the leadership of Donald J. Trump has heralded nothing less than a golden age for the country. According to the World Economy Outlook published by the International Monetary Fund (IMF) in October 2025, not very much of this has yet dawned. After real economic growth of 2.8 % reported under the former administration, only 2.0 % economic growth is forecast for this year, while for 2026 the USA’s economic growth is set to increase slightly to 2.1 %. While the GDP did grow by 3.8 % in the second quarter of 2025, this positive development was distorted by a sharp decline in imports (in the first quarter, the opposite was the case with just 0.6 % growth reported). Other economic pressures are starting to build up: retail sales are weakening, the number of new building starts has fallen to its lowest level since mid-2020, and tighter immigration regulations are leading to workforce shortages.
In his second term in office, President Trump has largely suspended the rules on international trade and levied high tariffs. In numerous negotiations, at the end of July this year and after, tariffs for imports from over 60 countries were revised and lowered, economic experts, however, still fear that the tariffs – irrespective of their ultimate form – will fuel inflation and stifle economic growth. For months now, there has been a dispute between President Trump and the US central bank, the Federal Reserve, the USA’s monetary authorities. Trump wants to kickstart the economy with low interest rates. The Fed Reserve wants to ward off any further growth in inflation and stem current inflation with higher interest rates. By September, the rate of inflation had increased to 3.0 %, the highest level after 2.9 % in January 2025.
2 Measures introduced by the new administration
In his second term in office, President Trump is governing predominantly with the help of decrees or executive orders. From the first day of his administration up to 15 October 2025, 215 executive orders had already been signed, the content of which is binding for the corresponding executive agencies. National security has been prioritized. One example is Executive Order 14159, which instructed the Department of Homeland Security to monitor the compulsory registration of aliens to safeguard national security. On 15 April 2025, an executive order was signed to safeguard national security with regard to processed critical minerals and their derivatives. In this, reliance on the imports of processed critical minerals is viewed as a serious national security risk to the US economy and defence capability. A programme has been launched to explore in depth ways to strengthen the US economy.
Even before this executive order was issued, on 20 March 2025 immediate measures were announced to boost American mineral production. This new order is aimed at strengthening domestic mining and to accelerate especially the extraction and processing of those minerals classified as critical. Prioritized in this order are the extraction of gold, uranium, copper, potash, and other minerals that have been identified by the National Energy Dominance Council (NEDC) as particularly important and critical.
A key starting point for the extraction of the urgently needed raw materials are the licensing procedures. In the past, these procedures were protracted and have become much lengthier over the last 20 years. By streamlining these procedures, the Trump administration wants to get new projects up, running and producing more quickly and eliminate existing bottlenecks.
On 8 April 2025, the Executive Order 14261 was signed to reinvigorate the American coal industry. This proclaims that it is the policy of the United States that coal is essential to national and economic security. Supporting the domestic coal industry is a national priority. This support is to come with the removal of regulatory barriers on federal level that hinder coal production as well as promotion of the use of coal to cover the rising domestic energy demand, an increase in American coal exports, as well as by ensuring that US federal policy does not disadvantage coal production or electricity generation in coal-fired power plants. In September, the Trump administration announced that it would release more than 5.3 mill. hectares of federal land for coal mining and make 625 mill. US$ available to support coal-fired power plants.
On 24 October 2025, regulatory relief was announced for certain stationary sources to promote American mineral security. This concerns stationary plants for copper smelting that are subject to the US Environmental Protection Agency’s (EPA) Primary Copper Rule, and which have now been exempted from compliance with the Copper Rule for a period of two years beyond the compliance dates. In the reasoning for this, it is explained how the Copper Rule presents the few remaining domestic copper smelters with considerable challenges and prescribes compliance with new national emission standards. According to this announcement, the technology to implement the Copper Rule was not yet available. Such technology did not exist in a commercially viable form, sufficient to allow implementation of and compliance with the Copper Rule by the compliance dates in the Copper Rule.
3 Overview of mining in the USA
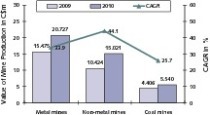
The US mining industry currently employs around 1.36 mill. people. 23.6 % of these are working in the coal industry, the other 76.6 % jobs are in other metal and non-metal resources operations (Fig. 1). The average yearly income of a mineworker at around US$ 95 000 is well in excess of the average yearly earnings of a worker in the USA, that is around US$ 72 000. The annual earnings of mining industry amounts to over 133 bill. US$, around 18 bill. US$ in taxes are paid annually by the mining employees. Accordingly, the mining industry constitutes a key economic factor in the USA. Figures and data on the sector are published by the National Mining Association (NMA) and the more than 20 mining associations in the individual US states. The data of the U.S. Geological Survey (USGS) provides useful information on the mining products. The USGS is a government agency which, like other agencies, is currently affected by the Senate shutdown.
Fig. 2 shows the US mining production by US state (2021), without energy resources. While around 82 % of the metallic ores were extracted in the USA’s western region and Alaska, sand and gravel for the construction industry were extracted in all the US states. Almost 40 % of the earnings for “non-fuel” resources were generated in just five states. Arizona alone accounted for 71 % of the country’s copper production, Nevada reached 74 % of gold production, Minnesota 85 % of iron ore while Texas and California are the states boasting the highest earnings for sand and gravel, which has to do with their large population share and construction sector there. Alaska as the northernmost state ranks in sixth place, with a 4.3 % share in the earnings. Gold, silver, zinc, and lead are still the most important resources in the northernmost state.
While the USA is rich in many mineral resources (Fig. 3), in worldwide comparison, however, the country occupies leading positions only for a few resources. Top rankings include the extraction of rare earths with 45 kt concentrates, putting the USA in second place in the worldwide ranking behind China, a third place for gold and lead behind China and Australia with 159 t and 300 kt respectively, fourth places for copper and molybdenum with 1.059 million tonnes per annum (Mta) and 32.7 kt, a fifth place for platinum group metals and zinc with 10 t and 750 kt respectively, an eighth place for silver with 1100 t/a, and other placings, for example, for nickel and cobalt. There are, however, numerous raw materials, for example bauxite for the aluminium industry where the USA does not have its own deposits. Thanks to its arms industry, the USA is a major buyer of rare earths, with a demand that it cannot cover with its own reserves.
3.1 Critical raw materials
The high import dependence for critical materials is regarded as a major issue for national security in the United States. Not only has a string of executive orders concerning these materials already been issued by the US president, but further considerations have been made. This also becomes clear in the most important publications from the USGS of the US Department of the Interior on the topic. Summarizing, it can be said that it is a matter of what impact trade interruptions for critical minerals is having on the US economy. Such impact is seen in the fall in the economic growth and the absolute figures, too. The supply of palladium is one example. Fig. 4 shows the existing suppliers for this raw material. The key suppliers are South Africa and Russia. The question is now what will it mean for the USA’s economy if palladium imports from Russia are interrupted for one year?
Fig. 5 shows which scenarios could occur in such a case, all based on the assumption that the USA’s demand will remain constant. Part A of the figure shows how in this case the prices for the raw material will change and what influence that will have on demand. Part B of the figure shows how individual countries will influence the price in such a scenario and what effect the available tonnage will have for the raw material. Outcome of the scenarios would be that the price would increase by 24 % and the available tonnage would fall by around 5 % after supplies from Russia are suspended (the net disruption level). Speculative (often temporary) price fluctuations on the spot market are not taken into consideration in this case; On the contrary, the price shift reflects the consequences of the shift in supply. The fact that the scenario did not indicate even bigger price and supply problems has to do with the fact that surplus production capacities, especially in South Africa, have been included in the calculations.
A full list of the raw materials classed as critical by the USGS is shown in Fig. 6. This figure might appear somewhat confusing at first glance, it includes, however, all important parameters. It shows 84 critical raw materials, each with the most important supply country. On the horizontal axis, for each raw material, you can see the probability that a supply shortage will result, on the vertical axis is the impact on the USA’s GDP. Accordingly, supply shortages for the key elements supplied from China with heavy rare earths like samarium, lutetium, terbium, and yttrium are regarded as highly probable, for widely used light rare earths like cerium, lanthanum, and neodymium, on the other hand, the probability of supply bottlenecks is smaller. Apparently, supply shortages of rhodium, niobium and platinum group metals will have the biggest economic impact. Interesting is that the USA and China have now come to an agreement that foresees no limitations by China on the supply of rare earths.
4 Key mining sectors
4.1 Coal industry
Here are the key figures. In 2011, 1096 mill. short tons (Mst with 1 short ton = 0.90718 t) coal were still produced in the USA, by 2019, this figure had fallen to 706.3 Mst. Fig. 7 shows the development of the production figures since 2020. Not much has changed, the figures have fallen from 535.4 Mst to 512.1 Mst (small quantities for coal recovery of 0.4 to 0,5 Mst are included). A peak was last reached in 2022 with 594.2 Mst. With regard to consumption, it can be seen that the largest percentage of the coal is used in coal-fired power plants (Fig. 8). Other industries as well as households and small commercial consumers only account for a relatively small percentage, exports have even increased sharply and recently peaked again. Current results for 2025 indicate that coal production and coal exports are rising again. While metallurgical coal is falling in the exports, thermal coal is rising.
Overviews of the biggest coal producers in the USA are available, for example, on the U.S. Energy Information website. According to this, in 2023 the three leading companies were Peabody Energy with 104.3 Mst and an 18 % share in the overall production, Arch Resources with 13 % and Navajo Transitional Energy with 7.9 %. In 2024, Peabody employed 5600 people and produced around 118 Mta coal (Fig. 9). Triggered by the so-called “power rebound” in the USA, the production volumes are set to increase. What perhaps is not known is that in 2024 Peabody successfully reached its first interim target for the reduction of greenhouse gas emissions (GHG) and lowered its Scope-1 and Scope-2 emissions by more than 35 % compared to the baseline in 2018. Core Natural Resources was formed in January 2025 from the merger of Arch Resources and Consol Energy. Together, the companies had produced 101 Mst coal in 2023. The company is regarded as the most important beneficiary of the “power rebound” in the USA.
4.2 Rare earths
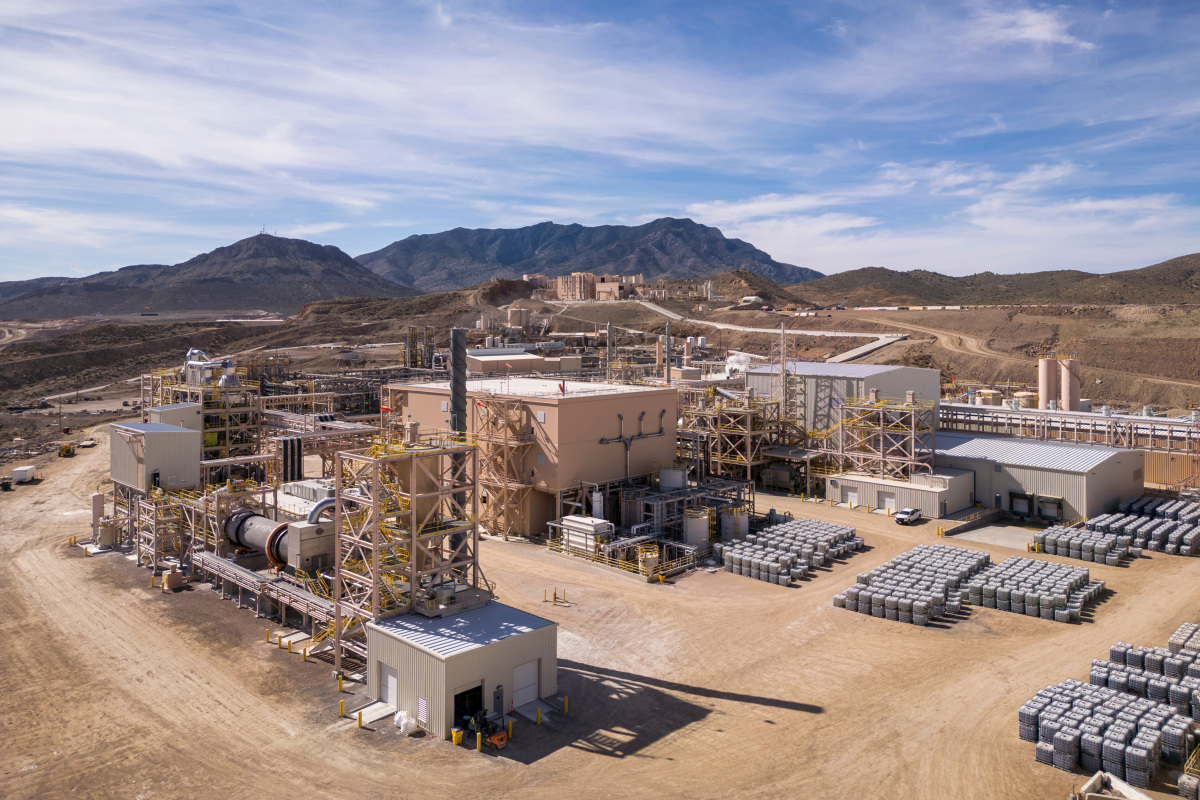
MP Materials Corp. is the biggest producer of rare earth materials in the western hemisphere. The company operates the Mountain Pass Rare Earth Mine and processing plant (Fig. 10) in San Bernardino County in California. In addition, the company is developing a production plant for rare earth metals, alloys and magnets in Fort Worth, Texas. The ore deposits in the mine extend over a depth between 4.5 and 76 m. The percentages of the individual rare earth metals in a typical concentrate from Mountain Pass are estimated as follows: cerium elements make up 50.2 %, lanthanum 32.3 %, neodymium-praseodymium 15.7 %, while others account for 1.8 %. Fig. 11 tracks the volumes produced over the last three years. The production of concentrates was relatively stable with a slight growth trend, the production of NdPr products seems to have started successfully.
In comparison with the production figures for rare earths from China, which amounted to around 270 kt at the last count, the figures from the Mountain Pass Mine reaches only 0.005 %. Since 2020, around 1 bill. US$ has been invested in the company. In 2025, a cooperation was entered with the US Defense Department (now War Department). From the sales of the products, 203.9 mill. US$ were generated in the last financial year. Cost of sales amounted to 192.6 mill. US$. With this and other costs, losses to the tune of 65.4 mill. US$ were made. In the financial year 2022, profits totalling 289.0 mill. US$ were registered. For the other potential operations for the production of rare earths in the USA, there are promising projects. The times to their realization, however, tend to be more in the medium term. The USA is therefore also cooperating with Australia, which can be become another major supplier.
4.3 Metal ores
Besides rare earths, the USA is high in the rankings for gold, molybdenum and copper. Copper may appear somewhat surprising if you consider the supremacy of Chile and Peru (Fig. 12). Behind these two countries and China, the USA holds a world market share of 4.6 % with 1.059 Mta copper at the last count, ahead of Australia, which only has a share totalling 3.6 %. Unlike the other countries, where volumes have remained constant or increased, the figures in the USA have fallen. Market experts see the reasons essentially in the high costs and the relatively lengthy licensing procedures for new mines. Apparently, very little will change with the costs, but with regard to the licensing procedures, the new administration appears to be adding fresh impetus. Objections from the environment agency or local residents or, for instance, the indigenous population tend to be subordinated to economic interests.
Fig. 13 shows the few countries that produce molybdenum. With a production volume of 32.7 kta at the last count, the USA holds a world market share of 13.0 %, following closely behind Peru and Chile, which have a market share of 16.2 % and 15.3 %, respectively. Here. China leads the field with a 35.7 % market share. The global production volumes for molybdenum appear to be stagnating. This can be seen as an indication of the fact that resources are dwindling for many metals and the continued high levels of consumption can only be sustained by maximizing recycling. For gold (Fig. 14) the picture is a different one. The material is popular with investors, especially against the upheaval on the global economy. The USA with 159.1 t/a and a global market share of 5.1 % is the third largest supplier behind China with 11.5 % and Australia with 9.2 %. But here, too, it is the same story as for copper; production levels are falling in the USA and here too the high costs and long licensing procedures are a competitive drawback.
5. Major companies
In this section, the leading mining companies in the USA are presented. Freeport McMoran (FCX) is the clear No. 1 with sales totalling 25.5 bill. US$ at the last count. FCX employs around 28 500 people worldwide, producing mainly copper, molybdenum and gold. In the USA, it operates seven surface copper mines (Fig. 15) and two molybdenum mines. For copper mining in the USA, the market share was around 58 % at the last count. Around 29 % of FCX’ copper production comes from North America, 28 % from South America, 43 % from Indonesia, where the company operates the Grasberg Mine. For gold, only 1 % of FCX’ production comes from North America, while 99 % is mined in Indonesia, for molybdenum the split is 75 % in North America and 25 % in South America. No. 2 in the USA is Newmont Mining. The company is headquartered in Denver, Colorado, and generated sales amounting to 18.7 bill. US$ in 2024, although with mining activities in Canada, Africa, Australia, Latin America and Papua New Guinea. In the USA, it only has a stake in Barrick Gold’s Nevada Gold Mine.
In third place in the ranking comes Southern Copper. The company is part of the Grupo Mexico Mining and generated sales totalling 11.4 bill. US$ in 2024. However, it has no mining operations in the USA, but only in Mexico and Peru. Further down the ranking are Peabody Energy with sales of 4.1 bill. US$ in 2024, Core Natural Resources (2.2 bill. US$), Coeur Mining (1.05 bill. US$) and Hecla Mining (0.93 bill. US$). Coeur Mining, headquartered in Chicago, operates the Rochester silver and gold mine in Nevada, the Kensington gold mine in Alaska (Fig. 16) and the Warf gold mine in South Dakota. Hecla Mining Company is the largest producer of silver in the USA and Canada. In the USA, it operates the Greens Creek Mine in Alaska and the Lucky Friday Mine in Idaho. In 2024, around 8.48 MOz silver were produced at Greens Creek. That corresponds to around 24 % of silver production in the USA. The two mines generate around 45 % of the US silver production.
Besides FCX, Newmont Mining and Southern Copper, numerous large mining companies that are headquartered outside the USA are also active in the country. These companies include, for example, BHP Billiton, Rio Tinto, South 32, Barrick Mining and Kinross Gold. Barrick is based in Canada and generated sales reaching around 12.9 bill. US$ in 2024. After Newmont, the company ranks as the second largest gold producer in the world, with an output of 3.91 MOz. 1.65 MOz alone come from the Nevada Gold Mines (Fig. 17), in which Barrick holds a 61.5-% stake. The other shares are held by Newmont Mining. Here are some interesting figures on the gold mine from 2024. The gold content in the ore is 1.1 % in the surface mine, 8.51% underground, the processed ore reaches 3.43 %. 155.6 Mta rock is extracted, including 130 Mta overburden, 19.5 Mta ore in the surface mine and 6.0 Mta underground. 1.646 MOz gold were sold, the revenue stood at 4.069 bill. US$, the cost of sales stood at 2.459 bill. US$ in 2024.
Rio Tinto‘s Kennecott copper mine (Fig. 18) is a so-called “world class mine” some way outside of Salt Lake City in Utah in the USA. Mining was started here back in 1903. Linked with the mining operations at the surface and underground are a processing plant and smelting plant. The lifetime of the mine should last at least until 2032. Apart from that, an extension is planned, which is to supply 0.25 Mta copper concentrate for the next ten years. For this, extensive investments have already been made. By 2050, the operation should be CO2-neutral.
Kinross Gold from Canada operates 4 mines in the USA: Fort Knox (Fig. 19) and Manh Choh in Alaska as well as Bald Mountain and Round Mountain in Nevada. At the Fort Knox Mine, the company extracted around 0.335 MOz gold in 2024, compared to its 0.774 MOz overall in the USA; worldwide, with other mine operations in Brazil, Chile and Mauritania, Kinross Gold mined a total of 2.17 MOz, which generated sales totalling 5.15 bill. US$.
6 Outlook
It is still too early to gauge the full impact of the Trump government on the mining sector. With the new focus on national security, the supply of critical resources is to be improved. There is even talk about the US government taking stakes in certain companies. Licences for new mine projects are to be granted more swiftly, with objections by the Environmental Protection Agency being given a back seat. With regard to the high costs, no significant improvements can be expected. The coal industry is on the rebound. It remains to be seen how fast the “power rebound” will be realized: the licensing and construction times for new power plants are an obstacle to this. Perhaps mothballed coal-fired power plants will be reactivated. It also remains to be seen what the international climate protection movement thinks of it.
Literature:
[1] USGS (2025): MINERAL COMMODITY SUMMARIES 2025, Version 1.2, March 2025, United States Department of the Interior, U.S. Geological Survey, Reston, Virginia/USA
[2] Nassar, N.T. et all (2025): Methodology and Technical Input for the 2025 U.S. List of Critical Minerals - Assessing the Potential Effects of Mineral Commodity Supply Chain Disruptions on the U.S. Economy. Open-File Report 2025-1047 by United States Department of the Interior, U.S. Geological Survey, Reston, Virginia/USA
Author:
Dr.-Ing. Joachim Harder, OneStone Consulting Ltd.
Varna/Bulgaria