Comparative studies of methods for quantitative microstructural analysis in mineral processing
 Quelle/Source: TU BAF IAM
 Quelle/Source: TU BAF IAM
 Quelle/Source: TU BAF IAM
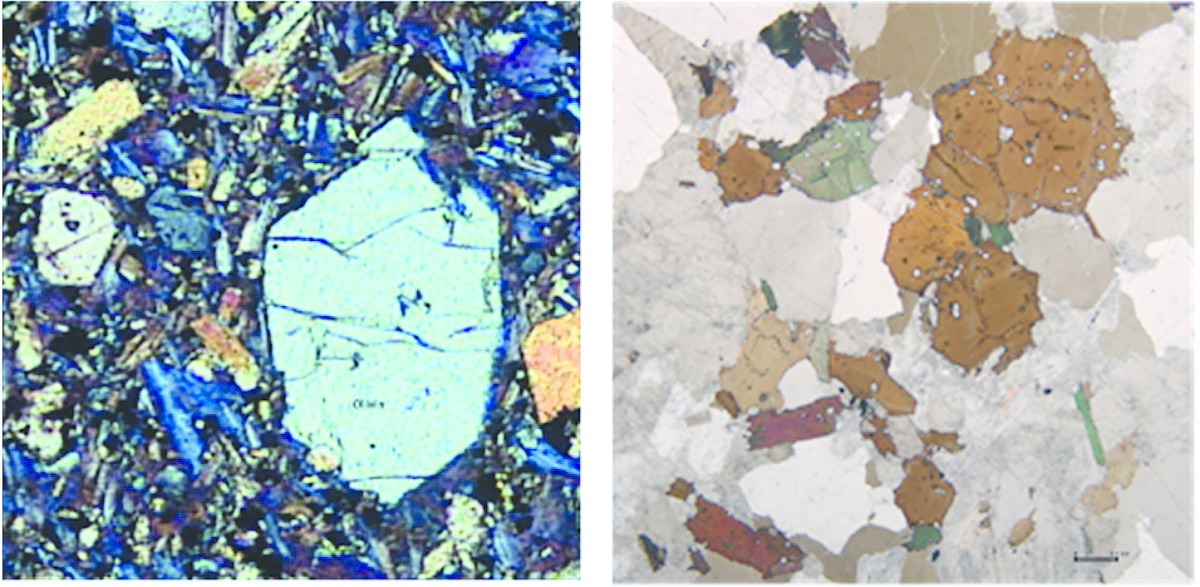
![3 Bilder von Lichtmikroskopie (links), REM (Mitte [19]) und Computertomographie (rechts) • Images of light microscopy (left), SEM (centre [19]) and computer tomography (right)](https://www.at-minerals.com/imgs/1/3/3/2/2/4/7/03_Abb._3-fa11f64f0c2d823b.jpeg) Quelle/Source: TU BAF IAM
Quelle/Source: TU BAF IAM
![4 Flussdiagramm zur Erzeugung von segmentierten, klassifizierten Bildern für die Bildanalyse [17] • Flow chart for making segmented classified images for image analysis [17]](https://www.at-minerals.com/imgs/1/3/3/2/2/4/7/04_Abb._4_korr-2f6bd86c0763c796.jpeg) Quelle/Source: TU BAF IAM
Quelle/Source: TU BAF IAM
 Quelle/Source: TU BAF IAM
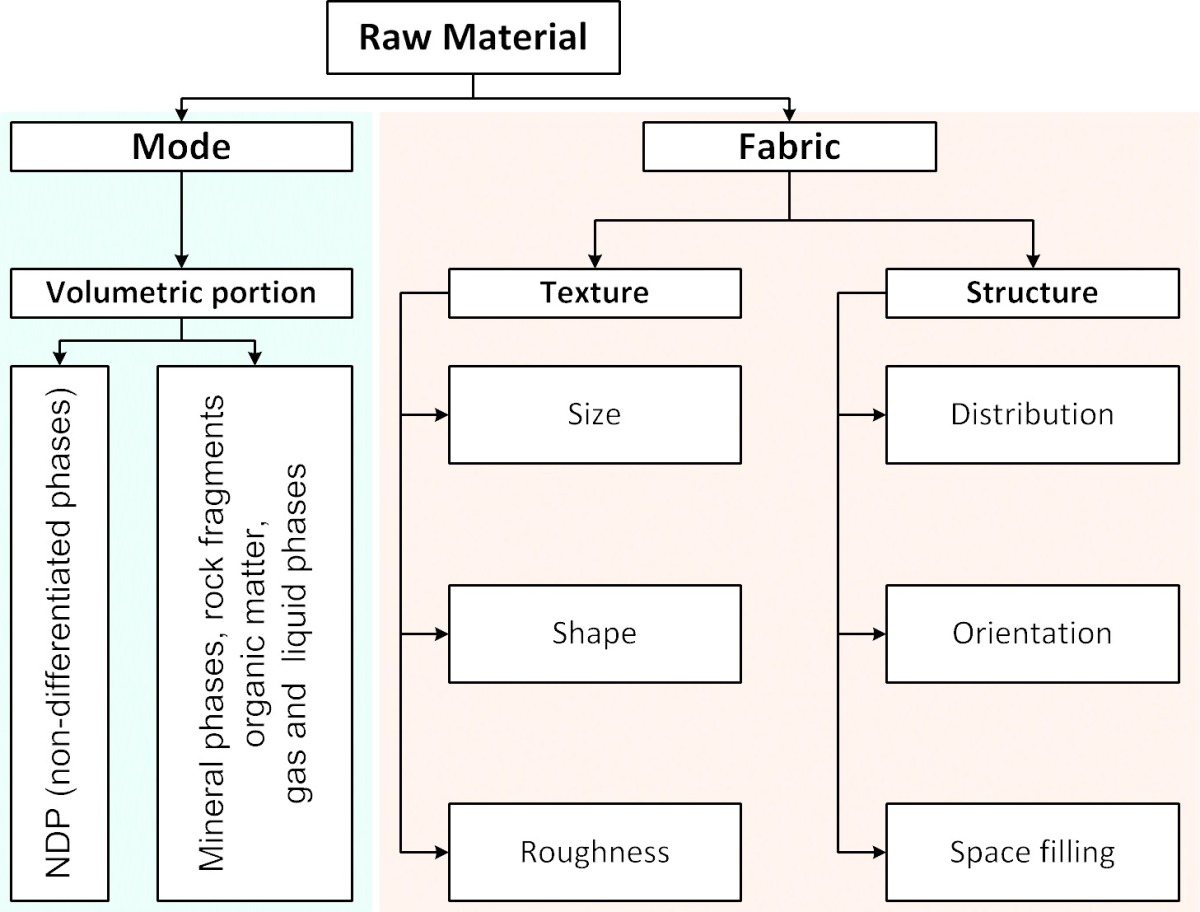
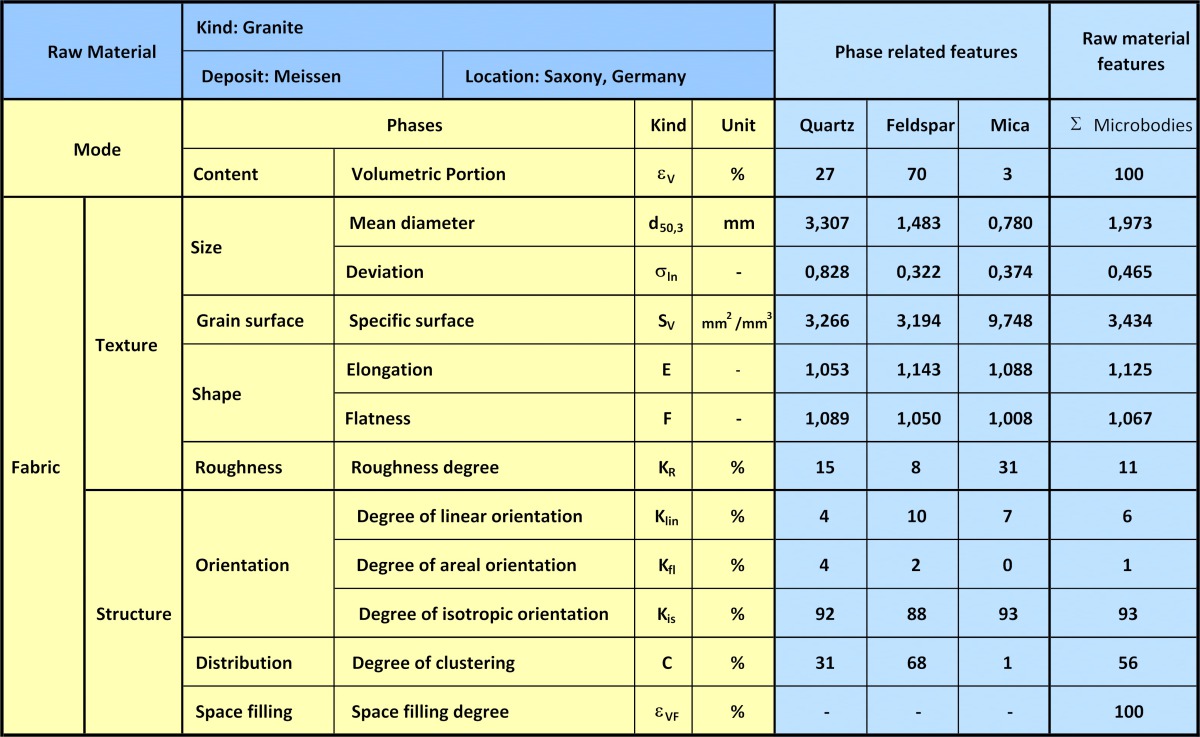
![6 Datenblatt Gesteinscharakteristika [35] • Datasheet on rock characteristics [35]](https://www.at-minerals.com/imgs/1/3/3/2/2/4/7/06_Abb._6_korr-024a2f609acc978e.jpeg) Quelle/Source: TU BAF IAM
Quelle/Source: TU BAF IAM
 Quelle/Source: TU BAF IAM
 Quelle/Source: TU BAF IAM
 Quelle/Source: TU BAF IAM
![10 Signalarten der Elektronen [29] • Electron signal types [29]](https://www.at-minerals.com/imgs/1/3/3/2/2/4/7/10_Abb.10-a2d9870b8de962d9.jpeg) Quelle/Source: TU BAF IAM
Quelle/Source: TU BAF IAM
![11 BSE-Bild (links – a) [17] und Topographiebild von SE (rechts – b) [42] • BSE image (left – a) [17] and topography image of SE (right – b) [42]](https://www.at-minerals.com/imgs/1/3/3/2/2/4/7/11_Abb_11-a6bfdae88f0e0b0c.jpeg) Quelle/Source: TU BAF IAM
Quelle/Source: TU BAF IAM
![12 EDX-Bild (links – a) [12] und Kathodolumineszenzbild (rechts – b) [39] • EDX image (left – a) [12] and cathodoluminescence image (right – b) [39]](https://www.at-minerals.com/imgs/1/3/3/2/2/4/7/12_Abb_12-24f9466857494776.jpeg) Quelle/Source: TU BAF IAM
Quelle/Source: TU BAF IAM
![13 Kikuchi-Linien (links – a) [10] und EBSD-Bild (rechts – b) [10] • Kikuchi lines (left – a) [10] and EBSD image (right – b) [10]](https://www.at-minerals.com/imgs/1/3/3/2/2/4/7/13_Abb_13-f4fc2e771ef835c7.jpeg) Quelle/Source: TU BAF IAM
Quelle/Source: TU BAF IAM
![14 Lichtmikroskopie (HF links – a) und BSE-Bild (rechts – b) [12] • Light microscopy (HF left – a) and BSE image (right – b) [12]](https://www.at-minerals.com/imgs/1/3/3/2/2/4/7/14_Abb_14-0729457182fb8e65.jpeg) Quelle/Source: TU BAF IAM
Quelle/Source: TU BAF IAM
![15 Scannen von Bohrkernen [26] • Core scanning [26]](https://www.at-minerals.com/imgs/1/3/3/2/2/4/7/15_Abb.15-4ebdf5e706644a02.jpeg) Quelle/Source: TU BAF IAM
Quelle/Source: TU BAF IAM
 Quelle/Source: TU BAF IAM
 Quelle/Source: TU BAF IAM
 Quelle/Source: TU BAF IAM

Summary: In different fields, quantitative microstructural analysis (QMA) has become established as a method for characterizing materials and raw materials. Many studies show that the microstructure of the raw materials significantly influences the product properties (e.g. product shape, particle size distribution), comminution energy and wear. For this reason, it is necessary not only to use qualitative data, but increasingly to collect and utilize quantitative data for optimization of mineral processing. This article provides an overview of selected processes and methods of QMA in geology, petrography, mineralogy and processing of mineral resources.
1 Introduction
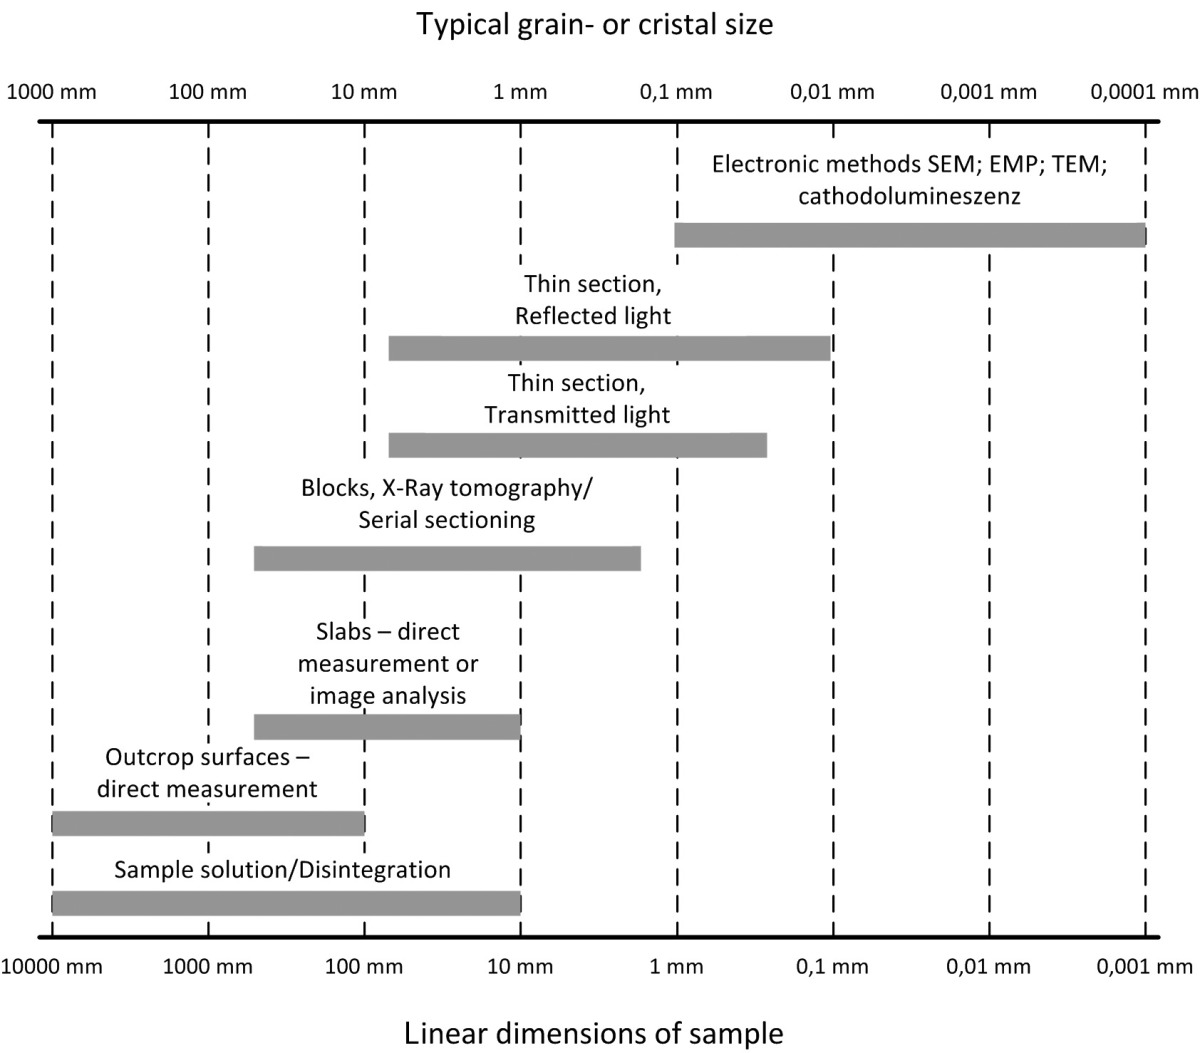
For the quantitative microstructural analysis of mineral resources, various analytical methods are available, For the quantification of microstructures, different values are required that characterize their modes, structure and texture. These methods differ with regard to preparation of samples for analysis as well as their resolution and range of application. With combinations of different methods, the range of application for the analysis systems is widened as not every analytical method allows the capture of all quantitative microstructural parameters.
The...