Journey round the world
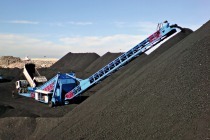
Trends in coal and ore transportation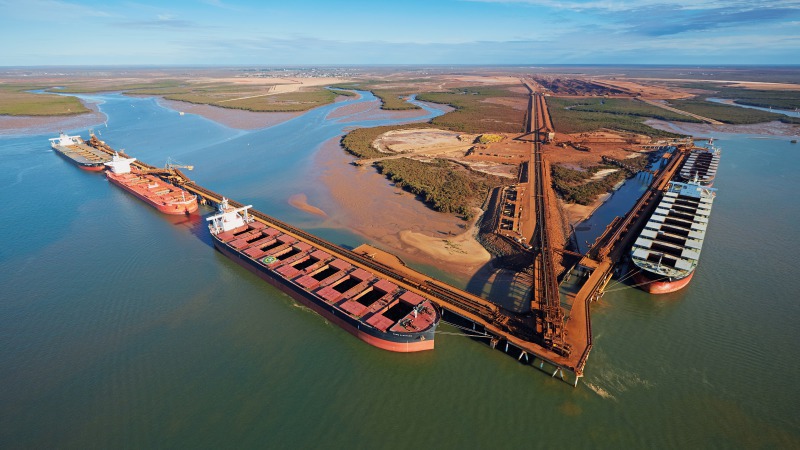 Quelle/Source: Fortescue Metals
 Quelle/Source: Clarksons Platou, OneStone Research
 Quelle/Source: OneStone Research
 Quelle/Source: OneStone Research
 Quelle/Source: VdK
 Quelle/Source: VdK
 Quelle/Source: VdK
 Quelle/Source: BHP Billiton
 Quelle/Source: Peabody Energy
 Quelle/Source: UNCTAD
 Quelle/Source: OneStone Research
 Quelle/Source: OneStone Research
 Quelle/Source: OneStone Research
 Quelle/Source: Vale
 Quelle/Source: Rio Tinto
 Quelle/Source: BHP Billiton
 Quelle/Source: Rio Tinto
 Quelle/Source: OneStone Research
 Quelle/Source: OneStone Research
 Quelle/Source: OneStone Research
 Quelle/Source: Rio Tinto
 Quelle/Source: Alcoa

Summary: After the figures for maritime transportation of coal and ore recently stagnated, a slight increase is forecast for the coming years. The following article describes a wide variety of market developments and market trends in the maritime transportaton of bulk commodities, and in particular in the transportation of hard coal, iron ore and bauxite, and presents the most important players in the market.
1 Introduction
In 2016, a total of 4.9 billion tonnes (bn t) of bulk commodities were shipped by seagoing vessels. This corresponds to a share of around 44 % of the global maritime transportation figure of 11.2 bn t, followed by crude oil and other petrochemical products with 27 % and container traffic with 16 %. In terms of tonne-kilometers, which are a measure of transport performance in global trade, dry bulk goods even account for 49 % of the total figure. The term dry bulk goods covers a very long list of commodities with over 100 individual items and includes such bulk materials as coal, iron ore, grain, fertilizers, bauxite, alumina, cement and different ores. However, coal and iron ore dominate the market figures and forecasts well ahead of any other bulk commodity.
2 Maritime transportation of coal and ores
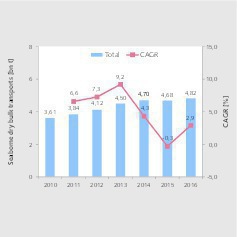
Maritime transportation of bulk commodities has increased significantly since 2010 (Fig. 1). In 2010, the seaborne volumes still only amounted to 3.61 bn t. In 2013, 4.50 bn t were transported, with annual growth rates of 6.6 % to 9.2 %. Since then, growth has slowed noticeably. In fact, in 2015 negative growth was recorded at -0.3 %. 2016 saw a slight recovery. For 2017 and 2018, the renowned Clarksons Research Services Ltd. forecasts growth of 4 - 5 %. However, the growth rates are essentially only dependent on the quantities of coal and iron ore, and in particular on how China’s demand for these two bulk commodities develops. Of course, this revolves around the Chinese steel industry, which needs both imported ore and coking coal. China also has a high demand for thermal coal and bauxite.
Fig. 2 shows the proportions of coal and ores in the global maritime transportation volume. Since 2010, coal and iron ore have together accounted for 52-54 % of the quantity transported by sea. In the depicted years, the quantities of coal increased from 898 million tonnes per year (Mta) to 1115 Mta, with a peak of 1187 Mta in 2014. The quantities of iron ore recorded the largest increase from 992 Mta to 1412 Mta. Exports figures for bauxite and aluminium oxide (alumina) were 93 Mta in 2010 and 116 Mta in 2016. The figures for other ores, which include nickel ore, manganese ore and copper concentrate, were 90 Mta in 2010 and 93 Mta in 2016, with significantly higher volumes of 130 Mta in 2013. All other bulk commodities, including cereals, fertilizers, cement, wood and metal products, reached quantities of 1532 Mta in 2010 and 2081 Mta in 2016, or proportions of 42.5 % and 43.2 %.
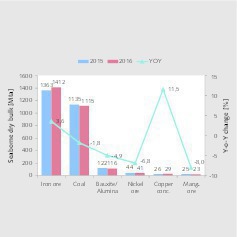
The development of maritime transportation of coal and ore is usually difficult to predict. The changes in seaborne volumes from 2015 to 2016 are depicted in Fig. 3. Iron ore shipments increased 3.6 % from 1363 Mta to 1412 Mta. Coal shipments fell by 1.8 % to 1115 Mta, and bauxite and alumina shipments declined by 4.9 % to 116 Mta. However, the largest percentage changes were recorded in the other ores. Copper concentrate increased in the single year by an impressive 11.5 % to 29 Mta, while nickel ore fell by 6.8 % to 41 Mta and manganese ore by 8.0 % to 23 Mta. In this context, however, it should be noted that the statistics on the commodities vary from one source to another - sometimes considerably.
3 Hard coal trends
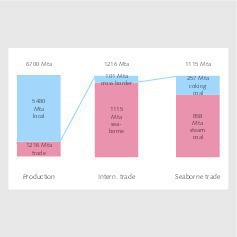
According to figures from the International Energy Agency (IEA), around 6.5 bn t of hard coal were produced worldwide in 2016. According to the figures of the Verein der Kohleimporteure (VdK) (Association of Coal Importers), production in 2016 was 6.7 bn t, which is almost 400 Mta lower than in 2014 (Fig. 4). Of the 6.7 bn t, 1216 Mta or 18.1 % went into world trade, while 5.484 bn t were consumed locally [1]. The trade volumes are divided into 1115 Mta or 91.7 % for maritime transportation and 101 Mta for other international transportation. It is interesting to note that power station coal (thermal coal) accounts for the lion’s share of maritime transportation with 858 Mta or 77 %, while coking coal (or metallurgical grade coal) only accounts for 23 %. In the last 3 years, coking coal’s share has decreased by 3 % compared to power station coal.
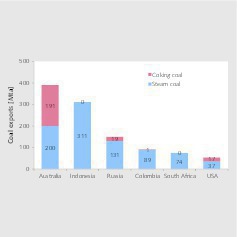
The TOP 6 export countries for hard coal are shown in Fig. 5. Australia is No. 1 in the ranking with a total of 391 Mta of exports in 2016, of which 200 Mta were thermal coal and 191 Mta were coking coal. This gives Australia a global market share of 35.0 %. Australia has thus defended its leading position vis-à-vis Indonesia, which, with a total of 311 Mta, has a market share of 27.9 % but leads the market in thermal coal. Russia is currently the clear No. 3 with a market share of 13.5 %, followed by Colombia with 8.1 % and South Africa with 6.6 %. The US lags behind somewhat with 4.8 %. All in all, the TOP 6 account for 96 % of global exports. Other important countries are Canada, Poland and Kazakhstan.
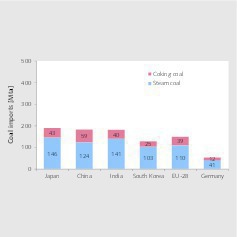
The largest global import volumes are accounted for by Asia and the EU (Fig. 6). The most important import country in 2016 was Japan with 189 Mta or 17 % of all imports, derived from 146 Mta of thermal coal and 43 Mta of coking coal. China follows in second place with 183 Mta of imports or a share of 16.4 %, closely followed by India with 16.2 %. South Korea, with its imports of 128 Mta or 11.5 %, almost equals the imports of the entire EU, which amount to 149 Mta. The market is practically divided into an Asian (Pacific) market and a European (Atlantic) market, with the Asian market accounting for 821 Mta, or almost 74 % of the world market. The most important supplier countries for the Asian market are Australia, Indonesia, South Africa and Russia, while the Atlantic market is mainly supplied by Russia, Colombia and the USA.
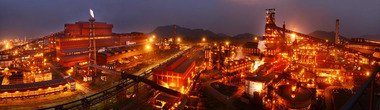
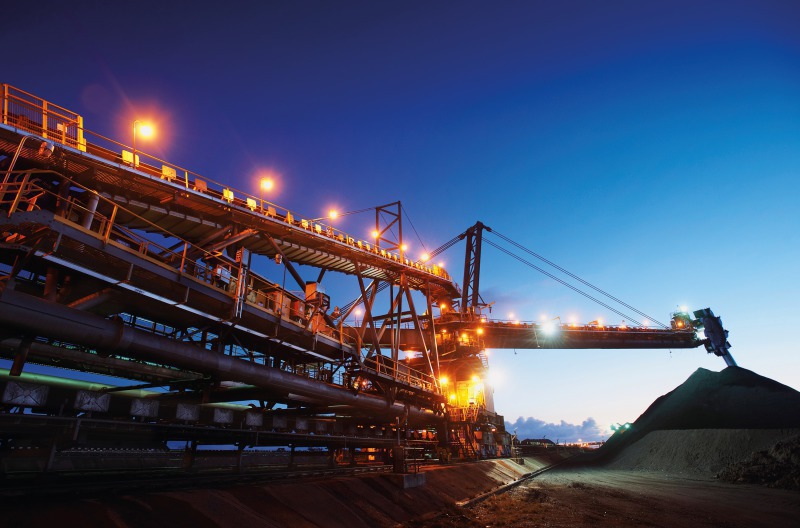
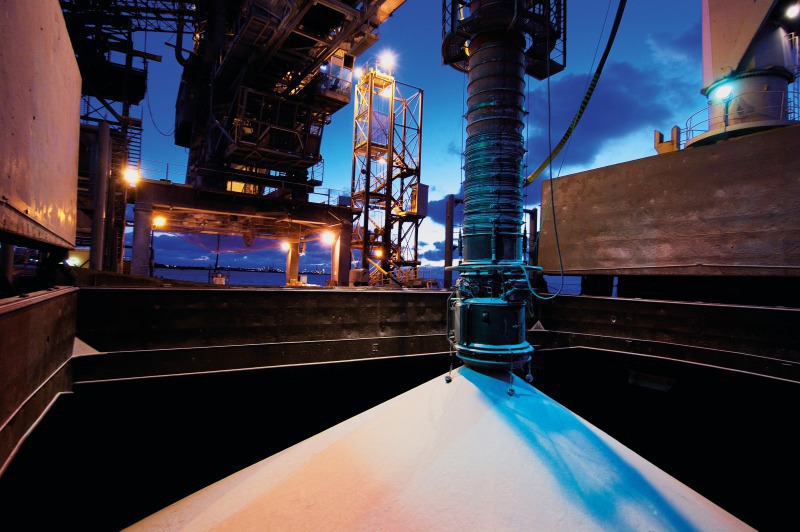
According to Euracoal, the umbrella organization of the European coal industry, thermal coal prices recovered to a level of 90 US$/t at the end of 2016. One important reason was coal production cuts in China. Coking coal recovered to a price level of 125 US$/t at the end of 2016, and prices of 150 US$/t were again achieved in the 1st quarter (Q1) of 2017. In China, imports of coking coal in the first half year (H1) of 2017 increased by 38 % compared to the same period of the previous year, with import prices returning to the 200 US$/t mark in July 2017. This has given a boost to the leading companies of the coal industry after years of losses. AngloAmerican has since canceled two planned coking coal mine sales. BHP Billiton (Fig. 7) has achieved the highest profits in the coal sector since 2009. Glencore and Rio Tinto have also recently benefited from the upturn. Companies have emerged from the crisis stronger, leaner and more profitable.
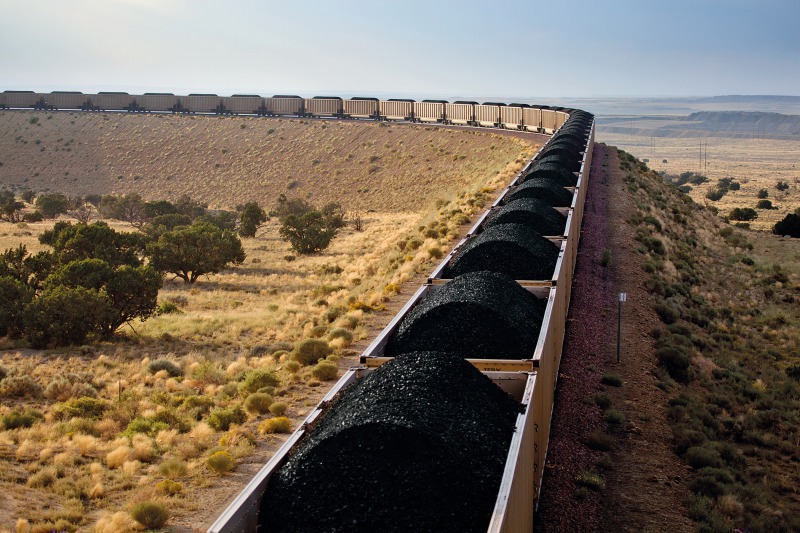
In the US, the coal industry and its major companies Peabody (Fig. 8), Arch Coal, Cloud Peak, Alliance, Whitehaven, Foresight LP and CNX Coal are enjoying an upswing. The Trump administration intends to repeal Obama’s “Clean Power Plan”. This had the objective of reducing the pollutant emissions of US power plants by 32 % by 2030, compared to the 2005 levels. In addition, the energy sector felt burdened by what it saw as unnecessary regulations. But for one thing, the Obama Plan has not been actually put into effect, as the US Supreme Court put the federal regulations on hold, and, secondly, the current push by the EPA Environmental Protection Agency will also create legal resistance. Ultimately, however, the new price structure for coking coal means that in the US alone, an additional 10 Mta that were previously not competitive will come onto the market.
4 Iron ore trends
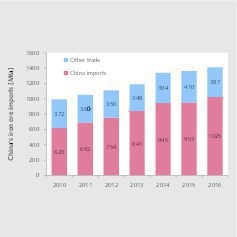
According to the United Nations Conference on Trade and Development (UNCTAD), iron ore production increased by about 5 % to 2106 Mta in 2016, although crude steel production increased by only 1 % to 1630 Mta. Prices for export iron ore with an iron content of 62 % fell to a low of less than US$ 40/t of CFR in January 2016. In July 2017, the average prices had recovered to US$ 71/t. Of the 1513 Mta exported in 2016, 1412 Mta or 93 % were transported by sea. The dependence of maritime transportation on China’s demand is evident (Fig. 9). China’s share has steadily increased from 62.5 % in 2010 to 72.6 % in 2016. Only in 2014 and 2015 did China’s imports falter due to the steel crisis.
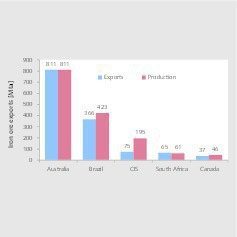
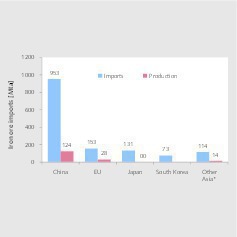
The most important iron ore exporting country is Australia, which is responsible for about 54 % of global shipments and 60 % of maritime transportation. Australia’s export quantities are enormous [2]. In 2015, it exported almost 100 % of the overall production quantity of 817 Mta (Fig. 10). Brazil comes in second with 366 Mta exports before the CIS countries, South Africa and Canada. The named 5 states or communities of states accounted for 90 % of all exports. The foremost importing country was China with 953 Mta, a figure which towers over China’s own production output of only 124 Mta (based on iron ore with 62 % Fe) (Fig. 11). This is followed by the EU28, Japan, South Korea and the other Asian countries (excluding India). These 5 states or communities of states account for 94 % of all imports. All exporting countries supply China and the rest of Asia, while the EU is mainly supplied by Brazil and to smaller extents by South Africa and the CIS countries.
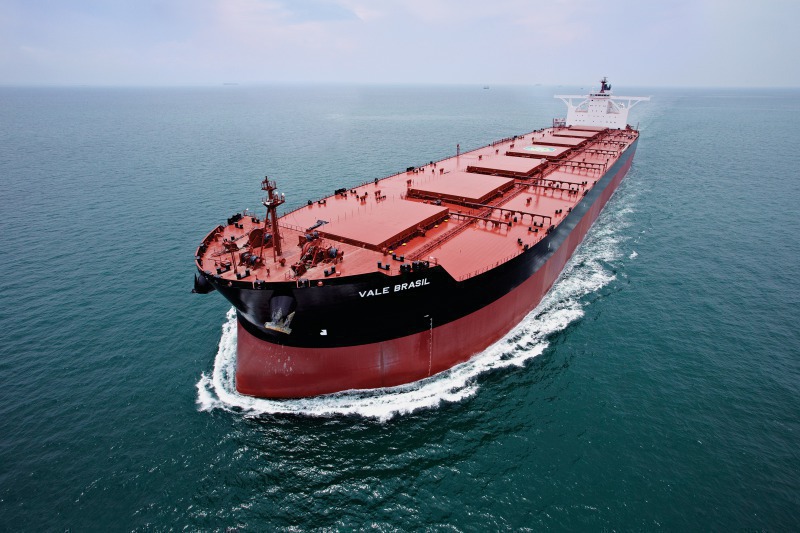
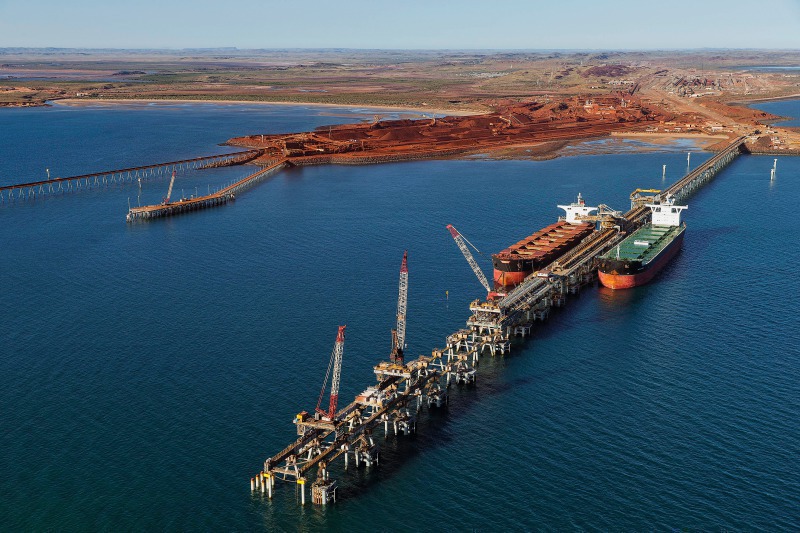
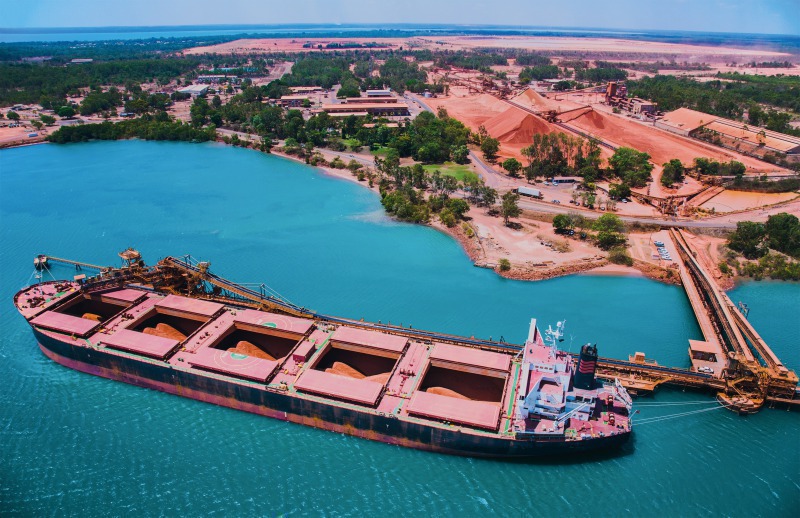
In 2016, the TOP 5 iron ore producers accounted for 56.3 % of the global production quantity of 2015.0 Mta (Fig. 12). Vale replaced Rio Tinto as no. 1 with 348.8 Mta, representing a market share of 17.3 %. Vale currently operates 11 open pit mines in Brazil, not counting the Samarco mine in which the company has a 50 % stake, which is currently closed down due to its headline-hitting 2015 dam failure. The 11 open pit mines can be assigned essentially to 3 mining areas, all of which have their own transportation systems to the iron ore ports of Tubarao, Ponta da Madeira and Itaguai. These ports have loading terminals for ships up to 420 000 dwt (Fig. 13). On exports to China, Vale has a freight cost disadvantage compared to its Australian competitors, but has been able to partially compensate for this by using larger vessels with costs of US$ 14.9/t in the second half of 2017.
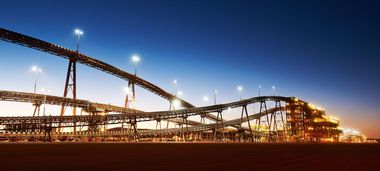
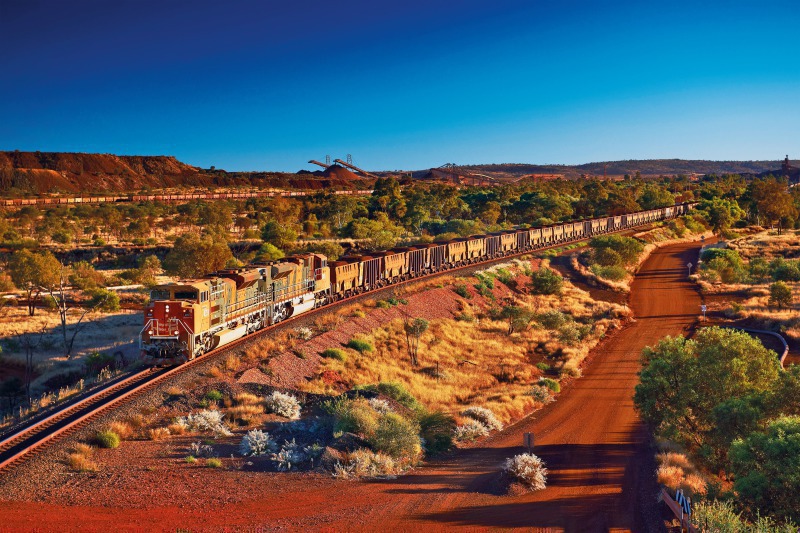
Rio Tinto, including its joint ventures (JV), produced a total of 329.5 Mta of iron ore in 2016, which was 6 % more than in 2015. Rio Tinto itself accounted for 270.7 Mta. The company owns 15 mines in the Pilbara region of Australia, which are among the most economical mines in the world. Port Lambert (Fig. 14) is one of its 4 terminals. In 2016, the company shipped 281 Mta of iron ore. BHP Billiton occupies 3rd place in the ranking with a quantity of 227 Mta from its numerous JV, including those with Mitsui-ITOCHU and ITOCHU Minerals. From BHP’s Mt Newman mine in the Pilbara region, the product goes on a 427 km long journey to Port Hedland (Fig. 15). Fortescue Metals has grown the fastest in the last few years and now produces around 168 Mta. Its iron ore is transported from Pilbara to Port Elliot by 13 trains per day carrying up to 35 000 t per load.
5 Bauxite trends
In the period 2010-2015, aluminum production increased by an average of 6.2 % per year from 42.6 Mta to 57.2 Mta. To produce 1 ton of aluminum about 4 tons of bauxite are required. With the growing demand for aluminum, fueled in particular by the needs of the motor vehicle industry, market experts such as CRU expect aluminum production to reach around 70 Mta by 2020, raising the demand for bauxite to above 300 Mta. China is already by far the most important producer of aluminum. In 2016, its share of global production was about 59 % and by 2020 this share should rise to 70 %. This must be viewed against the background that China already imported about 30 % of its bauxite requirements in 2016 and that in the coming years, local production is likely to decrease due to the decline in ore qualities.
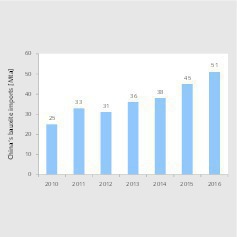
Fig. 16 shows China’s bauxite imports in recent years, according to data from Rio Tinto, which in some cases deviate significantly from other analysts’ data. The depicted increase in bauxite imports amounts to more than 100 %, rising from 25 Mta in 2010 to 51 Mta in 2016. Compared to the previous year, Asian Metal’s latest figures for H1 2017 show an increase in imports of 27.3 %, bringing them to 32.0 Mta. And this despite the fact that the Chinese government has detected 5.1 Mta of illegal production capacity and market experts are expecting China to close about 6.2 Mta of aluminum capacity in 2017. In addition, Indonesia, hitherto one of the main suppliers to China, completely stopped its bauxite exports in 2014, and Malaysia, also an important exporting country, implemented export restrictions in 2016.
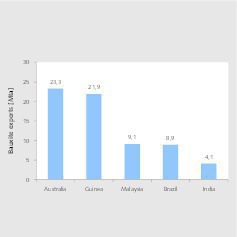
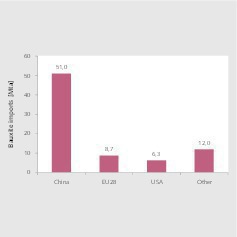
The most important exporting country for bauxite is Australia, with its 23.3 Mta in 2016 (Fig. 17). Guinea follows a short way behind with 21.9 Mta. Due to its export restrictions, Malaysia now reaches a figure of around 9.1 Mta after almost 20 Mta in 2015. Brazil and India are the other TOP 5 exporting nations. Market experts expect Australia and Guinea in particular to increase their exports significantly in the next few years. In the case of Guinea, an export quantity of 50 Mta in 2020 is considered realistic. On the import side (Fig. 18), China, at 51 Mta, accounts for about 65 % of all imports by sea. The EU is no. 2 in the ranking with 11.2 %, with member countries Ireland and Spain being the biggest importers. The US accounts for about 8.1 % of all imports with its figure of 6.3 Mta. The data shows that on the import side there is a preponderance of countries bordering the Pacific, while countries bordering the Atlantic account for the bulk of exports.
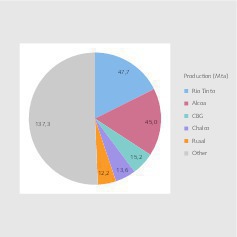
It is difficult to find data regarding the current rankings of the TOP bauxite companies. According to our own research, Rio Tinto is the no. 1 with a production volume of 47.7 Mta in 2016 (Fig. 19). The Company owns the Weipa and Gove bauxite mines in Australia, along with holdings in Brazilian and Guinean mines. Taking all the companies together, the Rio Tinto Group has an influence over a production quantity of 71.0 Mta. The group’s own companies and joint ventures also produce alumina and aluminum. In 2016, Rio Tinto shipped 29 Mta of bauxite to third parties (Fig. 20), making it the largest exporter in the sector.
Alcoa/AWAC follows in second place with a volume of 45.0 Mta or 16.6 %, of which 37.7 Mta come from its own mines and 7.3 Mta from mines in which the company has a holding. Its own mines are located in Australia, Brazil and Suriname; holdings exist in Brazil, Guinea and Saudi Arabia. In 2016, the company shipped 6.4 Mta to third parties (Fig. 21). The TOP 5 also includes CBG (Compagnie des Bauxites de Guinea), Chalco and Rusal. Chalco is currently the largest Chinese manufacturer of bauxite with a output of 13.6 Mta in 2016. In addition to its own production, the company imported 15.4 Mta. This makes it China’s third largest bauxite importer after Weiqiao (Shandong Hongqiao) and Chiping. Rusal still just manages to get a place in the TOP 5. It is followed by such companies as Norsk Hydro, South 32 and SMB-WAP.
6 Conclusions
Of course, the figures shown only represent the momentary situation and depend on a large number of influencing factors. Future developments in the world trade with ores are less and less dependent on established parameters such as economic development, per capita consumption, price developments, freight rates or existing and planned capacities, but increasingly on unpredictable parameters such as China’s mine closure decisions, export stops or export restrictions in Indonesia and Malaysia or even the increasing occurrence of extreme weather events. On the other hand, there are also certain recognizable trends, such as global concentration processes, where only the most efficient companies survive, China’s hunger for raw materials and Chinese investments outside of China [3].
Forecasts should therefore be increasingly viewed with caution. It is also interesting that market analyses are being published by more and more providers and that the results are becoming increasingly divergent - and that not only because the analyses are sometimes made with insufficient care. Our conclusion is that world trade in the commodities under consideration will continue to increase, mainly due to China’s needs and the inadequate quantity of raw materials mined in Chinese territory. However, in the case of coal and especially thermal coal it is difficult to make an accurate assessment, as has already been made clear by the growth forecasts for the last few years. In the case of iron ore and bauxite, we continue to expect an increasing demand in China, even if the planned capacity closures seem to contradict this.