The finite and the infinite
Trends in copper ore mining and processing
 Quelle/Source: ICSG
 Quelle/Source: Aurubis
 Quelle/Source: ICSG
 Quelle/Source: ICSG
 Quelle/Source: ICSG
 Quelle/Source: Brook Hunt
 Quelle/Source: BHP Billiton
 Quelle/Source: BHP Billiton
 Quelle/Source: Rio Tinto
 Quelle/Source: ICSG
 Quelle/Source: Outotec
 Quelle/Source: CRU International
 Quelle/Source: CMMC
 Quelle/Source: Southern Copper
 Quelle/Source: OneStone Research
 Quelle/Source: Codelco
 Quelle/Source: Brook Hunt
 Quelle/Source: First Quantum Minerals
 Quelle/Source: ICSG
 Quelle/Source: BHP Billiton
Summary: Consumption of copper has increased enormously in recent years. Demand is greater than supply and prices are climbing to record levels. Despite the fact that a very large amount of copper is recycled, the deposits are becoming progressively depleted and the content of copper in the ores is declining. The time will come when the entire consumption of copper has to be covered by recycled material. This report provides current market data, information about changes in the applied technologies and an overview of the main producers.
1 Introduction
Today, copper is as much an essential part of life as the air that we breathe. Without copper there would be no electric light, no telephone, no cars and no computers. There is virtually no limit to the range of possible applications for copper. This is due to its extraordinary material properties. Copper has excellent thermal and electrical conductivity and is extremely corrosion resistant. The material is relatively soft, ductile and robust and can be readily processed and formed. Moreover, copper is 100 % recyclable and can be remelted any number of times. Copper is also known for its alloys brass (copper and zinc) and bronze (copper and tin).
A large proportion of present-day copper applications are to be found in the building sector: copper cables in electrical systems and copper pipes in sanitary installations. Other important applications are in electro technology, air-conditioning and refrigeration technologies, automobile manufacturing and renewable energies. Copper is especially important for the new technologies. Whether in the new silicon computer chip or in modern rail vehicles, copper is always to be found where a reliable high-tech material is required. Leading manufacturers of hospital equipment, furniture, valves and fittings use the CU+ symbol to show that their products incorporate antimicrobial copper materials. The U.S. Environmental Protection Agency (EPA) has confirmed, for instance, that copper materials used in door handles continuously eliminate the bacteria that cause hospital-specific infections, so that more than 99.9 % are killed within two hours of contact.
As a result of advancing urbanization all around the world, the demand for copper is growing rapidly. Based on the present worldwide per-capita copper consumption of around 2.75 kg, market researchers of the renowned CRU Group forecast that the average per-capita consumption will be 4.65 kg by 2035. In the last few years, the production side was already suffering from an insufficient supply of raw material. This is due to the age of the existing mines, a constant decrease in the copper content of new ore deposits, a relatively low number of new mining projects, strikes, technical problems and also in some cases to poor weather conditions. Although the operating costs of most mining operations have risen considerably, the cost-effectiveness of some of the leading companies is extraordinarily good, showing EBITDA margins of over 40 to 60 %.
2 Market data
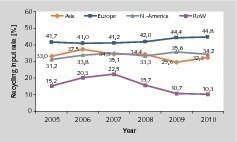
Optimistic estimates reckon that around 80 % of all the copper used since ancient times is still in the economic cycle today. In 2010, approximately 8.265 million tonnes per year (Mta) were derived from recycled material (scrap copper). That amounts to 33.9 % of the global copper consumption of 24.370 Mta in that year. However, there are large regional differences in the so-called “Recycling Input Rate = RIR” (Fig. 1). Europe has the highest RIR of 44.8 %, followed by America with 34.2 % and Asia not far behind with 32.3 %. But the rest of the world (Africa, Oceania, the Middle East) only achieves an RIR of 10.3 %. Europe’s very high RIR is certainly largely due to the fact that the region possesses very limited copper deposits, but there is also a long tradition of metal recycling in the region (Fig. 2).
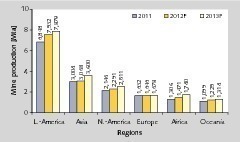
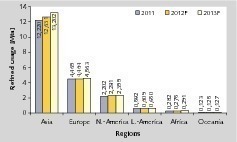
Large copper ore deposits exist in North, Central and South America, Africa and Oceania, Asian countries (Indonesia, China) and the CIS countries (Russia, Kazakhstan). In Europe, the largest deposits are to be found in Poland. Fig. 3 shows the current mine production data per region with a projection until 2013. Latin America has a dominant position, which in 2011 amounted to almost 43 % of the total worldwide production. The most important Latin American countries are Chile, Peru and Mexico. Asia with China and Indonesia produced 19 % while North America produced 13 %. By 2013, Latin America and Europe will fall back slightly while Africa’s production rate will increase. The worldwide usage data for refined copper shown in Fig. 4 indicate the location of the most important sales markets for copper. In 2011, Asia was a long way in the lead with 61 % (with demand in China alone making up 65 % of Asia’s consumption and 40 % of global usage), followed by Europe (22 %) and North America (11 %).
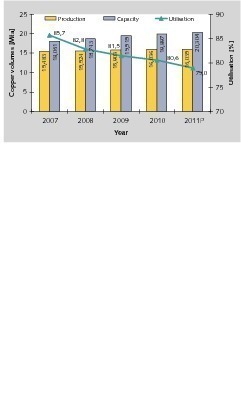
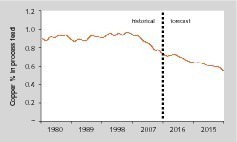
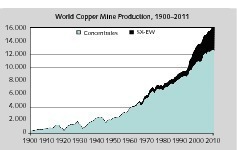
Demand for copper is currently higher than supply. As a consequence, mine production rates are also increasing. Around the year 1900 the total output was only 0.5 Mta, but since then the mine production figure has risen to over 16.0 Mta. In recent years, an increasing discrepancy between production rates and mine capacities has been noticeable (Fig. 5). Owing to the stronger growth of capacity, the capacity utilization dropped from 85.7 % to 79.0 % between 2007 and 2011. A further aspect is that copper resources are becoming scarcer, so that deposits of lower-quality ore have to be mined (Fig. 6). The average content of copper in the process feed fell by about 25 % from around 0.9 % in 1980s and 1990s to 0.65-0.7 % in the space of just a few years. It is anticipated that by 2015 the average content of copper in ores will be only 0.6 %. As a result, exploration costs will generally be considerably higher than they are at present.
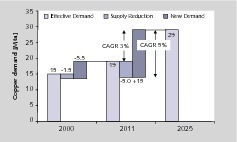
Also in the future, the only way to satisfy the steadily rising demand for copper will be to constantly develop new mines (Fig. 7). Copper demand increased from 15 Mta in 2000 to 19 Mta in 2011. By 2025, it is expected to grow to 29 Mta [1]. Due to the declining yield of existing copper mines, the annual demand will increase by 15 Mta. If the production rates of existing mines remained constant, that would result in an annual increase in demand of 3.0 %. However, in Chile alone the amount supplied by existing mines is going to decrease from 5.4 Mta to around 3.2 Mta. The global output of all existing mines will decline by approximately 5 Mta by 2012, so that an annual increase in capacities of 5.3 % will be necessary in order to meet the demand for copper.
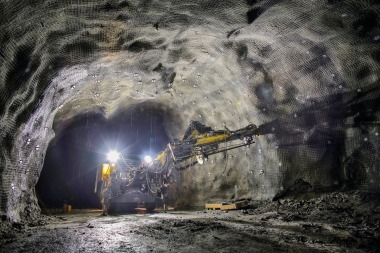
3 Copper ore processing
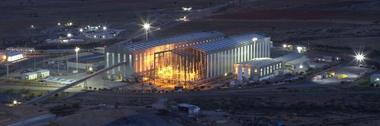
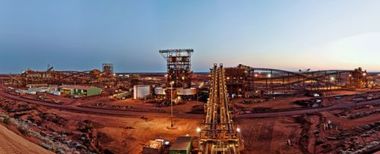
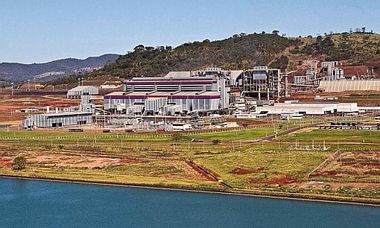
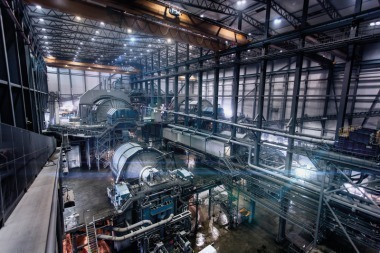
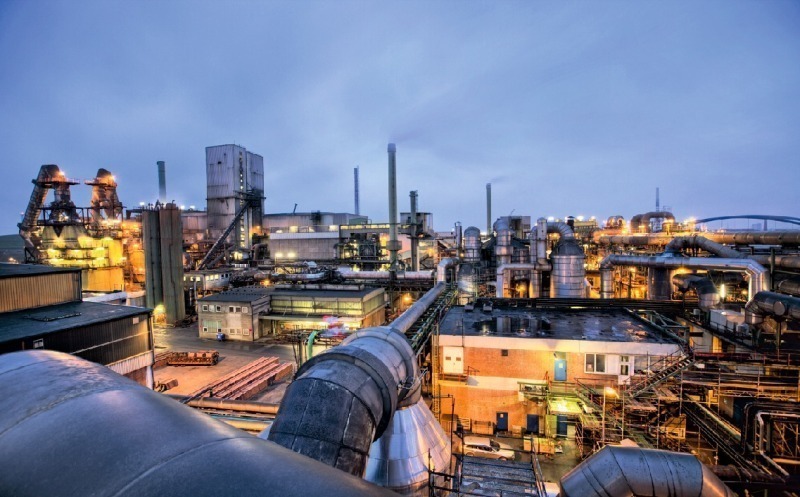
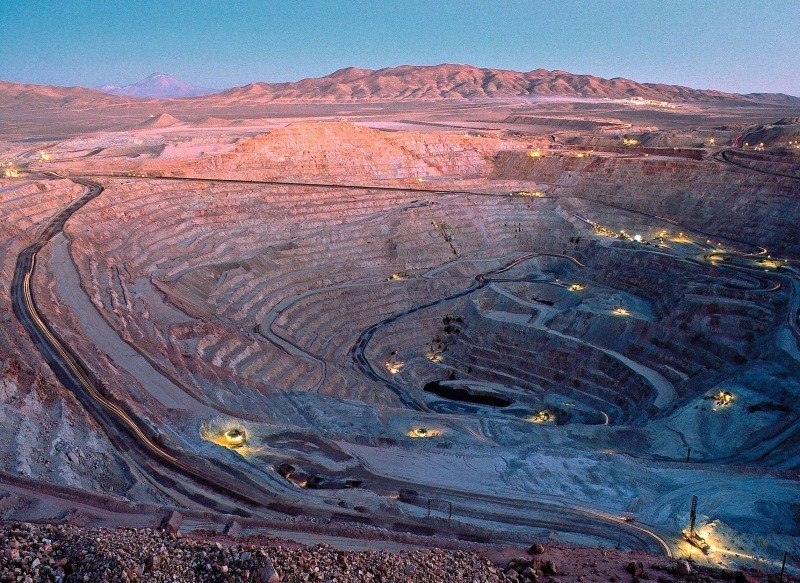
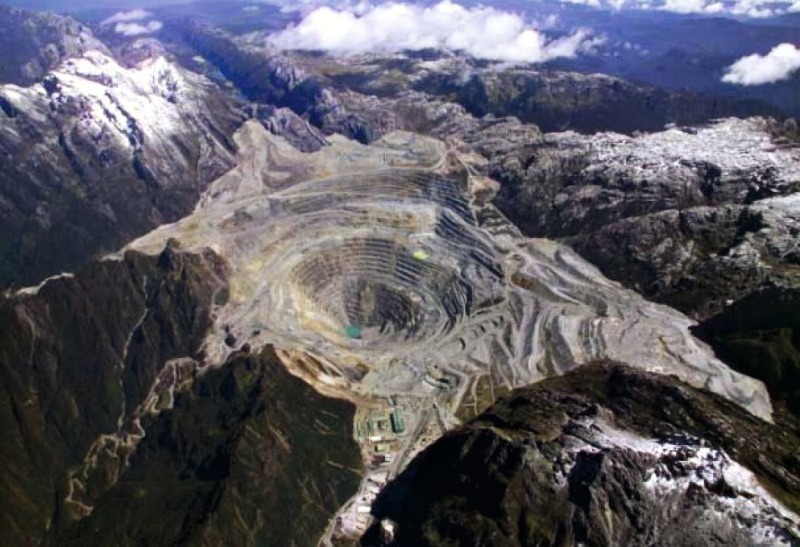
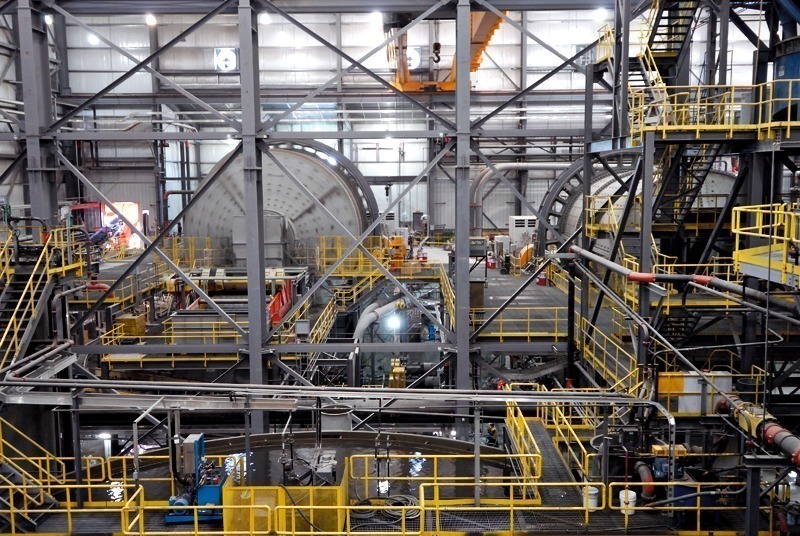
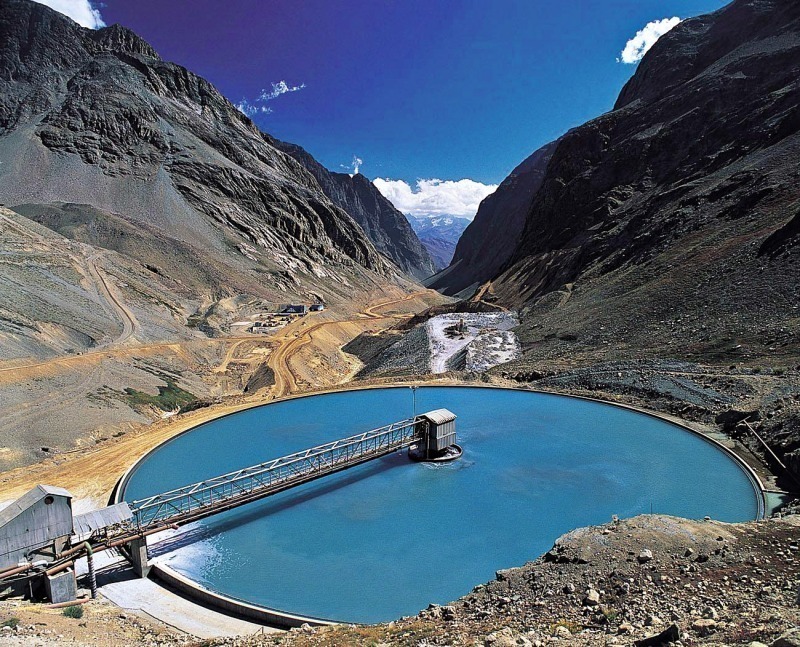
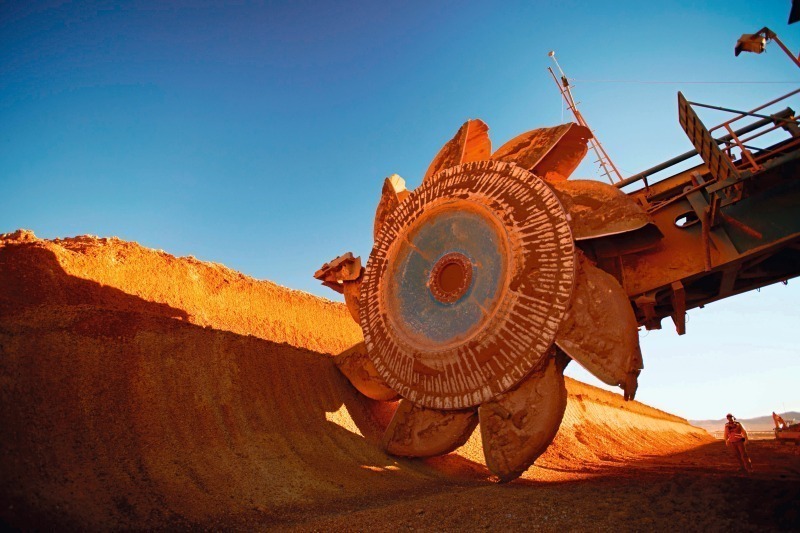
Copper ores are extracted in both open pit mines and underground mines. The ten biggest copper mines in the world have a total capacity of 5.9 Mta (Table 1), which corresponds to around 30 % of current mining capacity. Three mines are much larger than all the others; these are Escondida (Fig. 8) and Codelco Norte, which are both located in Chile, and Grasberg (Fig. 9) in Indonesia. Table 1 also provides information about the leading mining companies and the processes they use. The dressing of sulphidic ores (e.g. CuFeS2 – chalcopyrite/copper pyrites) usually consists of concentration by grinding and subsequent flotation followed by pyrometallurgical processing. Oxidic ores (Cu2O – cuprite/red copper ore) are generally processed hydrometallurgically with extraction of the copper by leaching and subsequent electrolysis (SX-EW process).
SX-EW processes were practically non-existent in the copper industry before 1960, but since then they have accounted for a continuously increasing proportion of copper production (Fig. 10). At present, SX-EW processes account for 3.4 Mta or 21.2 % of copper production. Practically all the large mining operations now apply this process (Fig. 11). This is largely due to the improved ketoxime and aldoxime-type leaching reagents that possess excellent Cu/Fe selectivity properties, are highly stable and have outstanding leaching kinetics [2]. On the other hand, bioleaching and biooxidation methods are making EW processes more and more popular. Instead of using acid for the leaching, bioleaching processes make use of iron and sulphur-oxidizing bacteria and archaea to convert the hardly soluble copper-iron sulphide into water-soluble, leachable sulphates, in the course of which the watery solution of the copper ores is acidified, favouring the solution of the heavy metal sulphides [3].
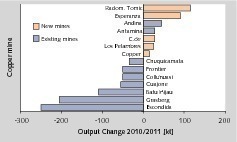
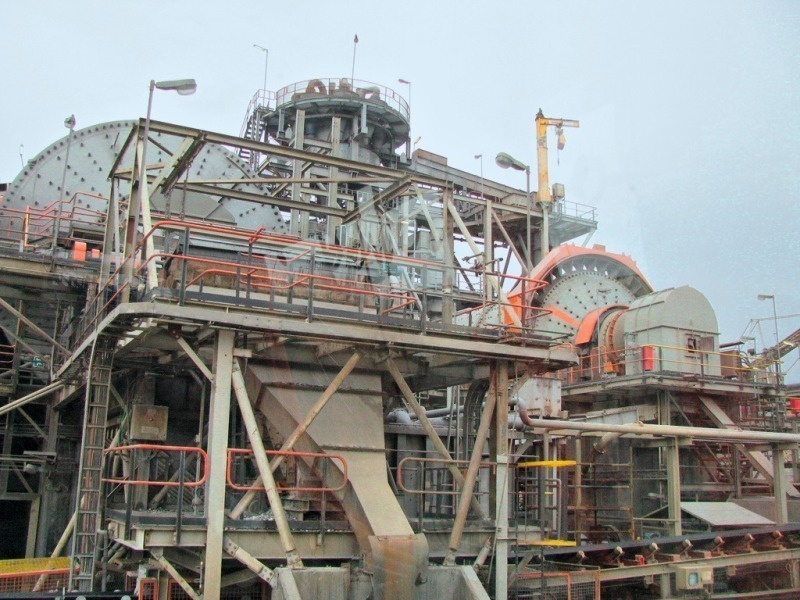
In 2011, the new mining capacity that was put into operation could not compensate for the decline in copper ore production at the existing mines (Fig. 12). In fact, only five major projects came into service in 2011: Copper Mountain in Canada (Fig. 13) and Los Pelambres, Carmen de Andacollo, Esperanza and Radomiro Tomic (all in Chile). These five mines produced 0.275 Mta in 2011. The only existing mines that achieved higher outputs in 2011 than in 2010 were Antamina in Peru and Andina in Chile, which produced a total of 0.075 Mta. By contrast, the output reduction at just two mines, Escondida and Grasberg, amounted to 0.455 Mta. When the output reductions at the mines Batu Hijau (Indonesia), Frontier (Congo), Collahuasi and Chuquicamata (both in Chile) and Cuajone (Peru) are added to those of Escondida and Grasberg, the overall shortfall reaches 0.755 Mta.
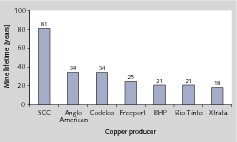
The U.S. Geological Survey has calculated the current global copper reserves to be 690 million tonnes (Mt). With the current production rate of 16.1 Mta, the reserves would last almost another 43 years if no new copper deposits are found and the annual production rates do not increase. Correspondingly, the current mine lifetimes of the leading copper producers are relatively short (Fig. 14). SCC (Southern Copper) currently has reserves of 58.8 Mt which will provide a lifetime of 81 years at the present production rate. Anglo American and Codelco have reserves of 20.9 and 132.6 Mt respectively, which result in lifetimes of only 34 years each. Freeport can achieve a lifetime of 31 years with its available reserves, which have been expanded by 62 % since 2007. Given constant general conditions, the industry giants BHP Billiton, Rio Tinto and Xstrata can only realistically expect their reserves to last for 21 and 18 years.
4 The most important copper producers
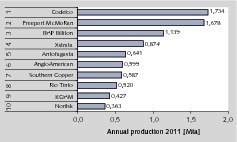
The TOP 10 producers have a production figure of 8.562 Mta, which is 53 % of the worldwide copper production from ore processing plants (Fig. 15, data for 2011). The market leader is Codelco (Corporacion Nacional del Cobre de Chile) with a production of 1.734 Mta or 10.8 % global market share. The company is 100 % state-owned. In 2011 Codelco’s copper came from six mines: Chuquicamata, Radomiro Tomic, El Teniente (Fig. 16), Andina, Gabriela Mistral and Salvador, which are all located in Chile. The 2nd place in the rankings, not far behind Codelco, is occupied by Freeport McMoRan (FCX) with a copper production of 1.678 Mta and a market share of 10.5 %. FCX is a global player and owns copper mines in North and South America, Africa (DR Congo) and Indonesia. 55 % of the company’s copper production in 2011 came from the three mines Grasberg (Indonesia), Morenci (USA) and Cerro Verde (Peru). BHP Billiton is in 3rd place with a production rate of 1.139 Mta and a market share of 7.1 %.
The subsequent rankings with market shares of around 5 % and less are held by Xstrata (5.4 %), Antofagasta (4.0 %), Anglo American and Southern Copper (3.7 % each), Rio Tinto (3.2 %), KGHM Polska Miedz (2.7 %) and Norilsk Nickel (2.3 %) and Glencore International, who also have a production rate of 0.363 Mta and a 2.7 % market share. However, the market is characterized by a high degree of variation in the annual ranking list. For example, Southern Copper and Antofagasta proved to be winners in the recent past. Southern Copper increased its copper production of 0,485 Mta by 0,102 Mta from 2009 to 2011 while Antofagasta raised its output of 0,443 Mta by 0,198 Mta or almost 45 % in the same period of time. By contrast, Anglo American and Rio Tinto were not able to maintain their 2009 production figures. Anglo American’s output dwindled from 0.678 Mta by 0.158 Mta, representing a decrease of 23 % up to 2011.
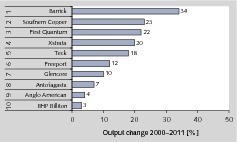
Fig. 17 provides an overview produced by Brook Hunt analysts, showing which companies have achieved the fastest growth in copper production from copper ore since the year 2000. These growth figures take acquisitions into account. Barrick Gold has achieved the fastest growth of 34 % even though the company only managed a copper output of 0.065 Mta in 2011. Places 2 and 3 are taken by Southern Copper and First Quantum with growth rates of 23 and 22 % respectively. First Quantum Minerals (FQM) is a Canadian mining company that was established as recently as 1983. In 2011, FQM already produced 0.266 Mta of copper at two mines in Africa. 86 % of that figure came from the Kansanshi Mine (Fig. 18) in Zambia, which works a deposit with a high copper content of 1.2 %. The Brook Hunt analysts predict that FQM will achieve the fastest growth of all companies on the sector. The firm’s annual growth rates are expected to be 29.2 % from 2011 to 2016. Place 2 in the rankings of the copper-producing companies with the fastest growth is taken by Vale with approximately 13 %.
5 Capacity expansion and projects
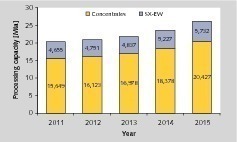
According to the ISSG (International Copper Study Group), copper production capacities will rise from 20.304 Mta in 2011 to 26.159 Mta in 2015 (Fig. 19). This corresponds to an absolute growth of almost 29 % and an average annual growth of 6.6 %. As a result of project postponements and delays caused by licensing procedures, it is expected that 74 % of the new capacities will not be ready for operation until 2014/2015. Differently to what one would probably suppose, the ISSG forecasts that conventional processes will be responsible for the greatest growth of 4.8 Mta absolute and an annual growth rate of 6.9 %, while SX-EW processes will only account for 1.1 Mta, with an annual growth rate of 5.4 %. Most new mine projects and mine extensions will take place in Chile, Peru, Brazil, the USA, China, Mongolia, Zambia and the DR Congo. Peru and Chile alone will be responsible for 19 and 12 % of the growth. Around 0.4 Mta should come from countries that have not previously produced copper, such as Angola, Ecuador, Panama and Sudan.
Escalating mine development expenses represent a considerable problem for the copper industry. While the average costs in the period 1985 to 2005 were still 5.660 kUS$/t and only increased by a moderate 18 % up to 2006-2010, to reach 6.667 kUS$/t, they are expected to leap by 106 % to 13.739 kUS$/t in the period 2011-2014. For example, the expected CAPEX costs for expanding the Escondida V and VI by 400 kt/a are US$ 5.0 billion, corresponding to a capital intensity of 12.3 kUS$/t copper equivalent per year. Expansion of the mines Andina and El Teniente in Chile will involve a capital intensity of 13.1 and 13.2 respectively. Although there are also projects like Codelco Norte’s Chuqui that only have a capital intensity of 4.6, the general reality is at the higher end of the project cost scale. FCX is planning to extend Cerro Verde in Peru by around 0.275 Mta for US$ 3.5 billion. Vale is preparing to put the Salobo I project into operation in 2012 at an investment cost of US$ 2.34 billion for a 0.1 Mta project. Minera Panama’s Cobre Panama project is going to cost US$ 4.3 billion for a capacity of 0.255 Mta (capital intensity of 15.0). The average copper content of the Cobre Panama deposit is 0.41 %.
6 Prospects
Although the average copper content of the earth’s crust is 0.0006 % and copper come 23rd in the order of frequency of all elements in the earth’s crust, the economically exploitable copper reserves will be exhausted within a few generations. Even today copper ores with contents below 0.5 % are being mined or will be mined in the future. This will result in an exponential increase in ore processing costs, as can already be seen by the current project expenses. This provokes the question of when it will no longer be worth producing copper from ore and at what point the industry will totally switch to the production of copper from recycling material to cover demand.